20 min read 15 pages walkthrough
SILONG: the storyboard, and the talk we never gave
Our storyboard for ASEAN Data Science Explorers 2026, exactly as submitted, with the talk we wrote for the national finals and never got to give.
When a disaster forces people from their homes in the Philippines, two times in three they end up somewhere the government never records. These 15 pages are how we showed it, and what we would have said about each one if we had reached the finals.
ASEAN Data Science Explorers asks two-person teams to tell a data story in SAP Analytics Cloud (SAC), in at most 15 pages, on a problem tied to a UN Sustainable Development Goal (SDG). Ours was about where Filipinos go when a disaster forces them out of their homes, and why the record loses them.
These are the 15 pages we submitted, unchanged. Under each is what we would have said if we had reached the finals: we wrote the script on 10 Sep 2026, and the shortlist didn’t include us. On five pages I’ve added a short note on what I would change now. Three charts are also redrawn for readability, because the originals are hard to read at this size. That was one of the judges’ points, and they were right.
With the switch below, you can also see each page as we designed it. We drew the whole deck first as an ordinary slide file, then rebuilt it in SAC, because the competition only accepts charts made in SAC. The words and numbers are the same. Only the second version could be submitted, and the gap between the two is most of what the note is about.
For the full story of what went right and wrong, read the note The checks caught my mistakes. They couldn’t catch my priorities.
1 · Silong
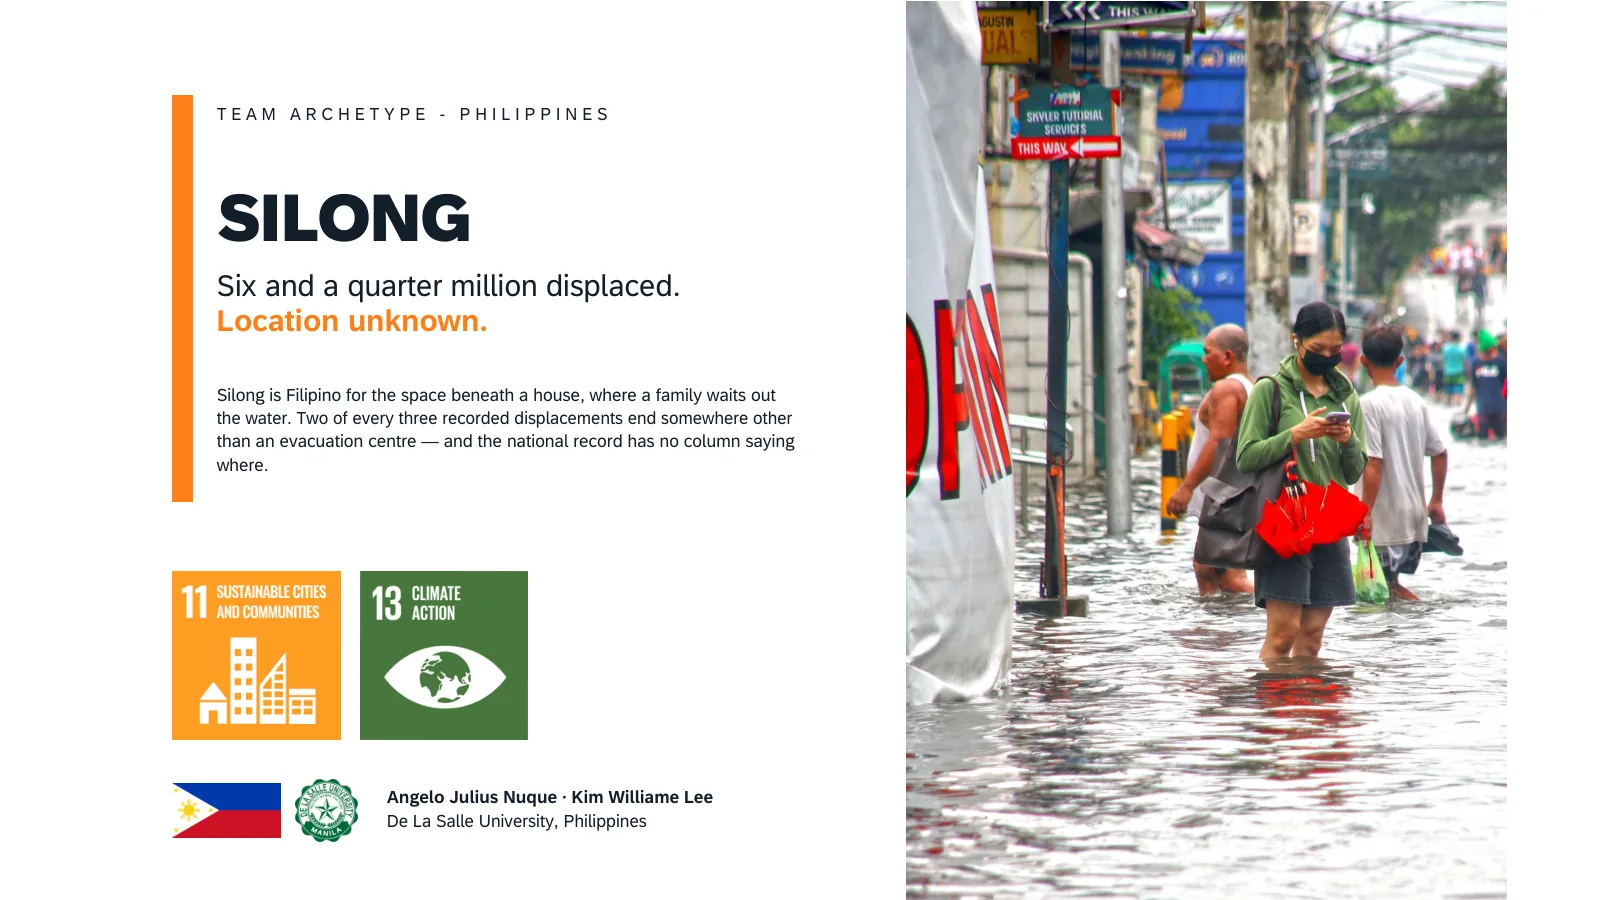
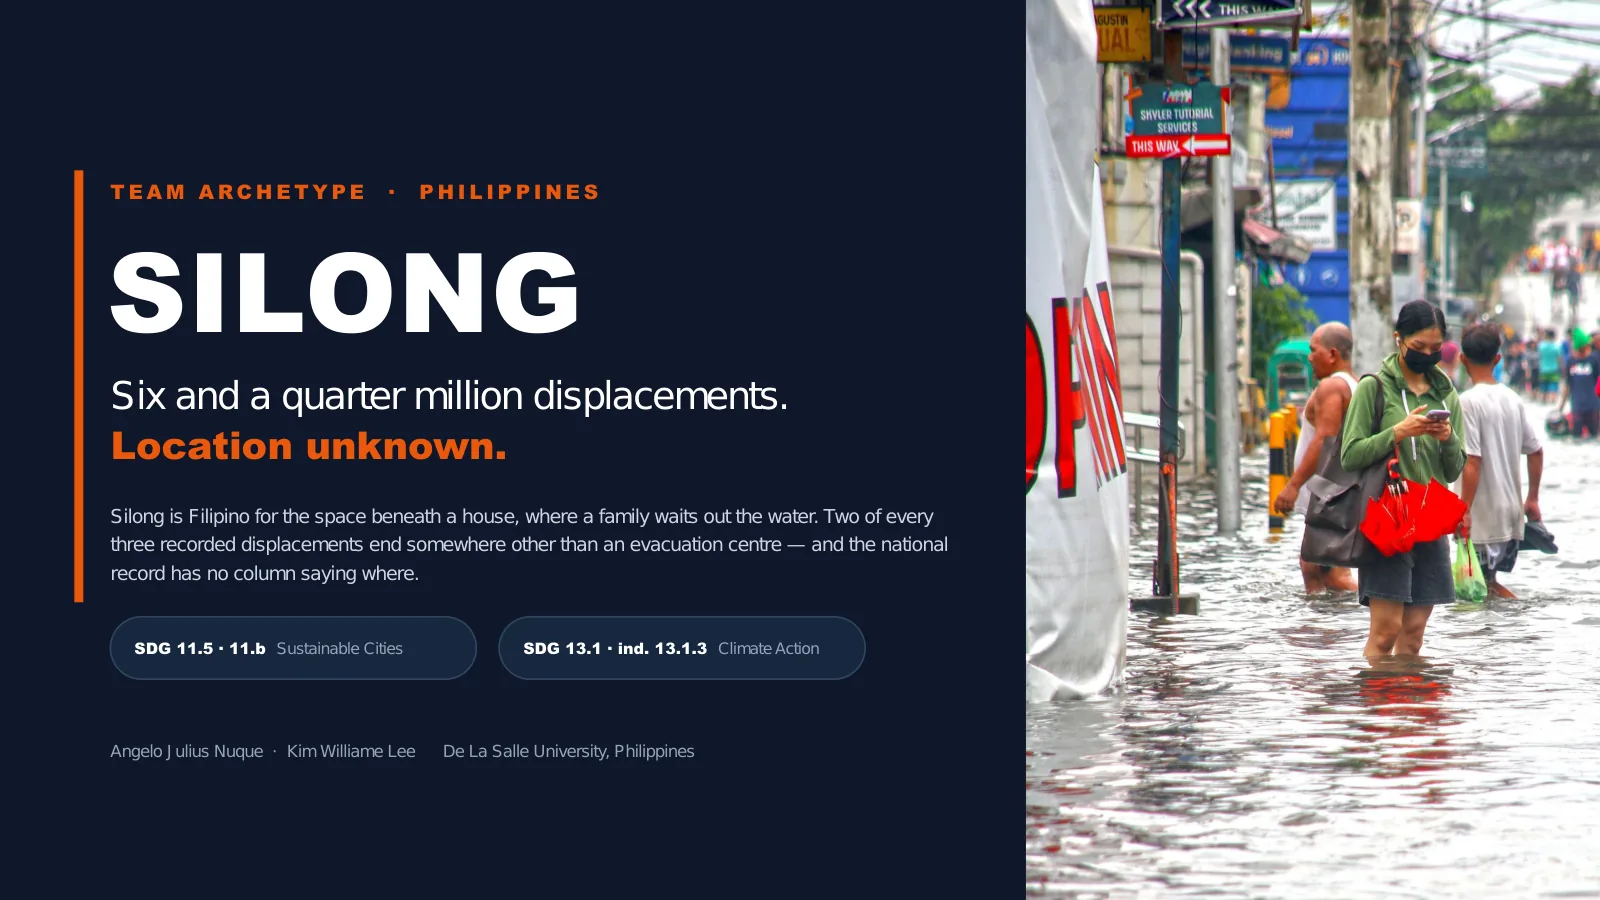
Silong is the Filipino word for the space beneath a house. It is where a family goes when the water rises and they have nowhere else. It is not a shelter anyone built, just the underside of their own home.
We spent three years of Philippine disaster records looking for those families. The records know exactly how many of them there are. They do not know where a single one of them went.
2 · Twenty years of records end at a blank column
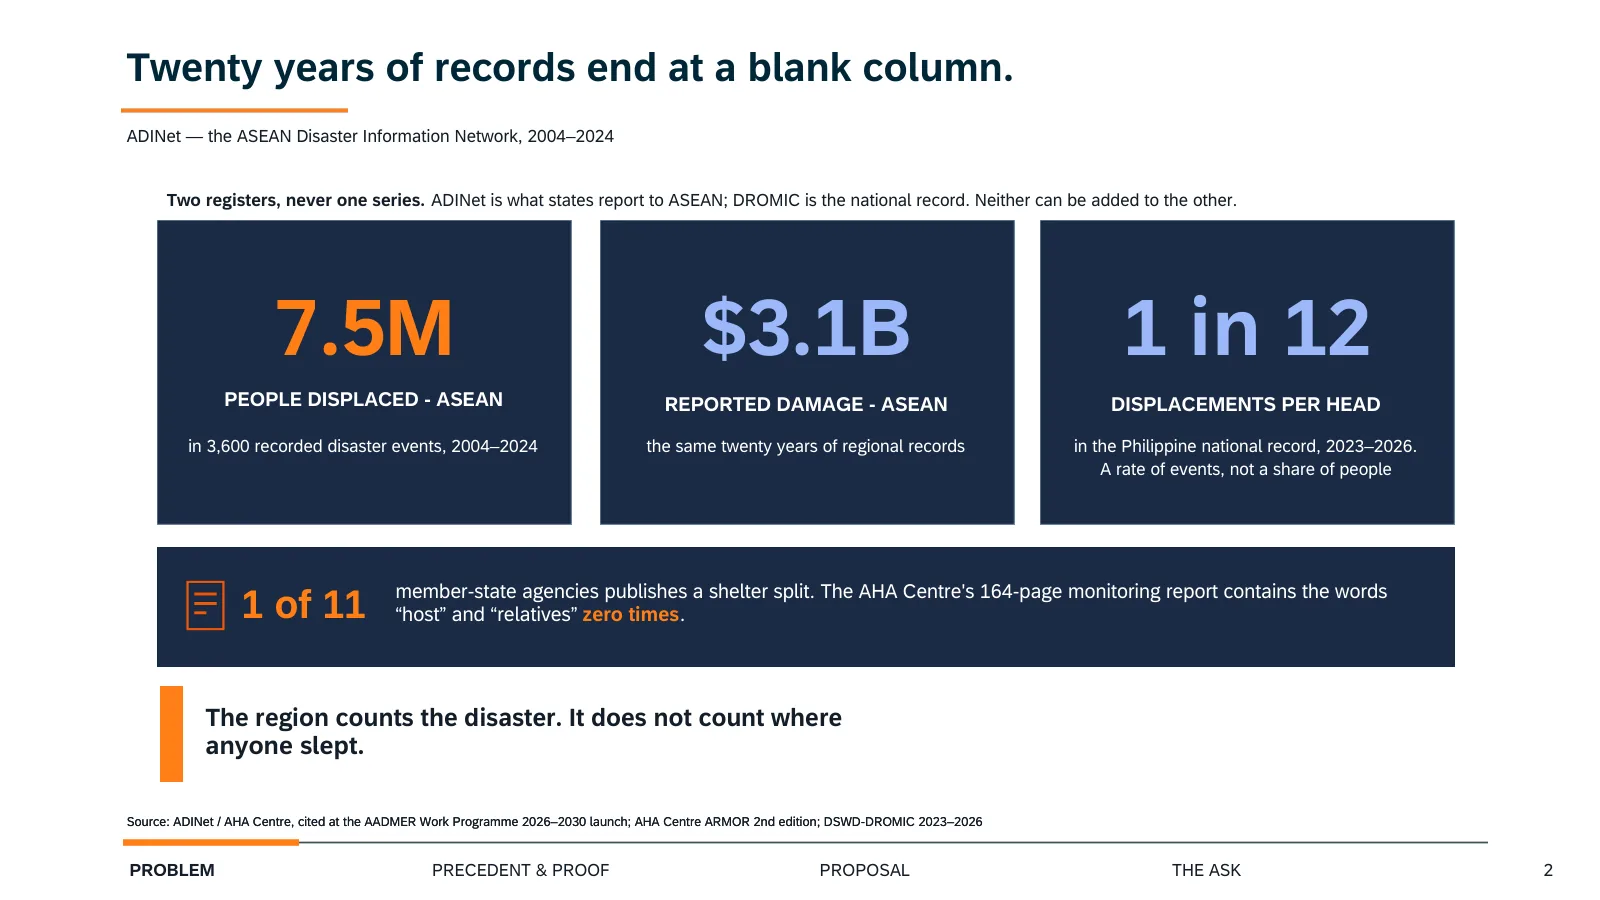
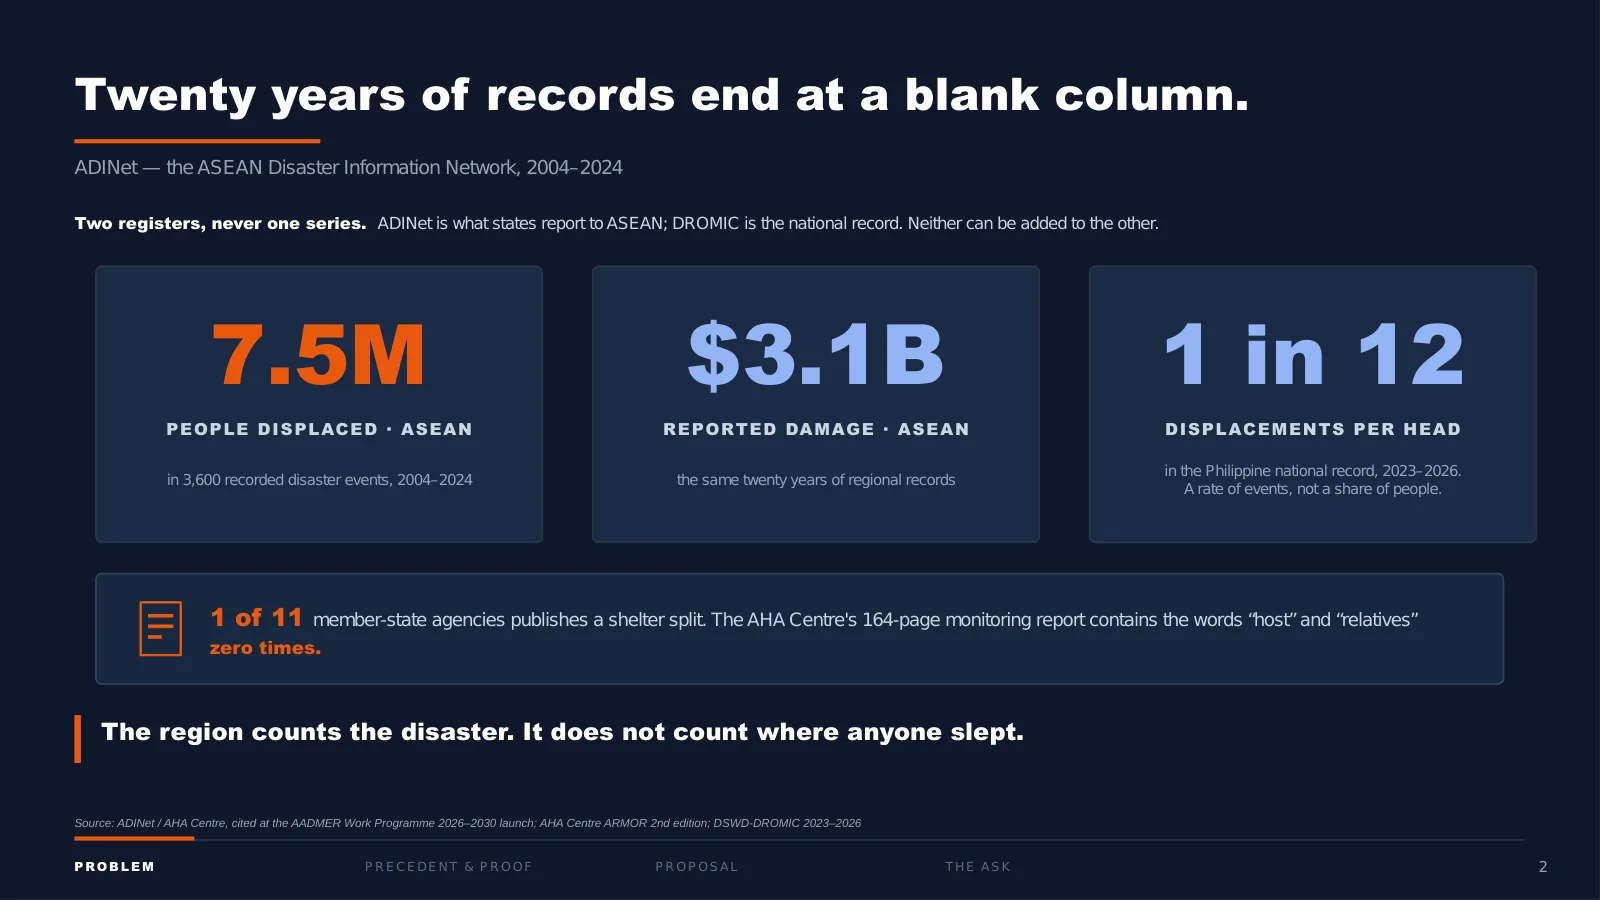
This is ADINet, the disaster database the Association of Southeast Asian Nations (ASEAN) actually runs. Twenty years, 3,600 events, 7.5 million people displaced, USD 3.1 billion of damage.
It is a good database. It records what happened and what it cost. It has no column for where the people went, and neither does any national system that feeds it. We checked all 11 member states: one publishes a shelter breakdown of any kind. The regional monitoring report of the ASEAN Coordinating Centre for Humanitarian Assistance (AHA Centre) runs to 164 pages and never once uses the word “host.”
One caution on the third tile, because it is the one that gets misread: it is a rate of displacement events per head of population, not a share of people. A household displaced by two typhoons is in it twice.
So the region counts the disaster. It does not count where anyone slept.
3 · Two in three
Redrawn for readability
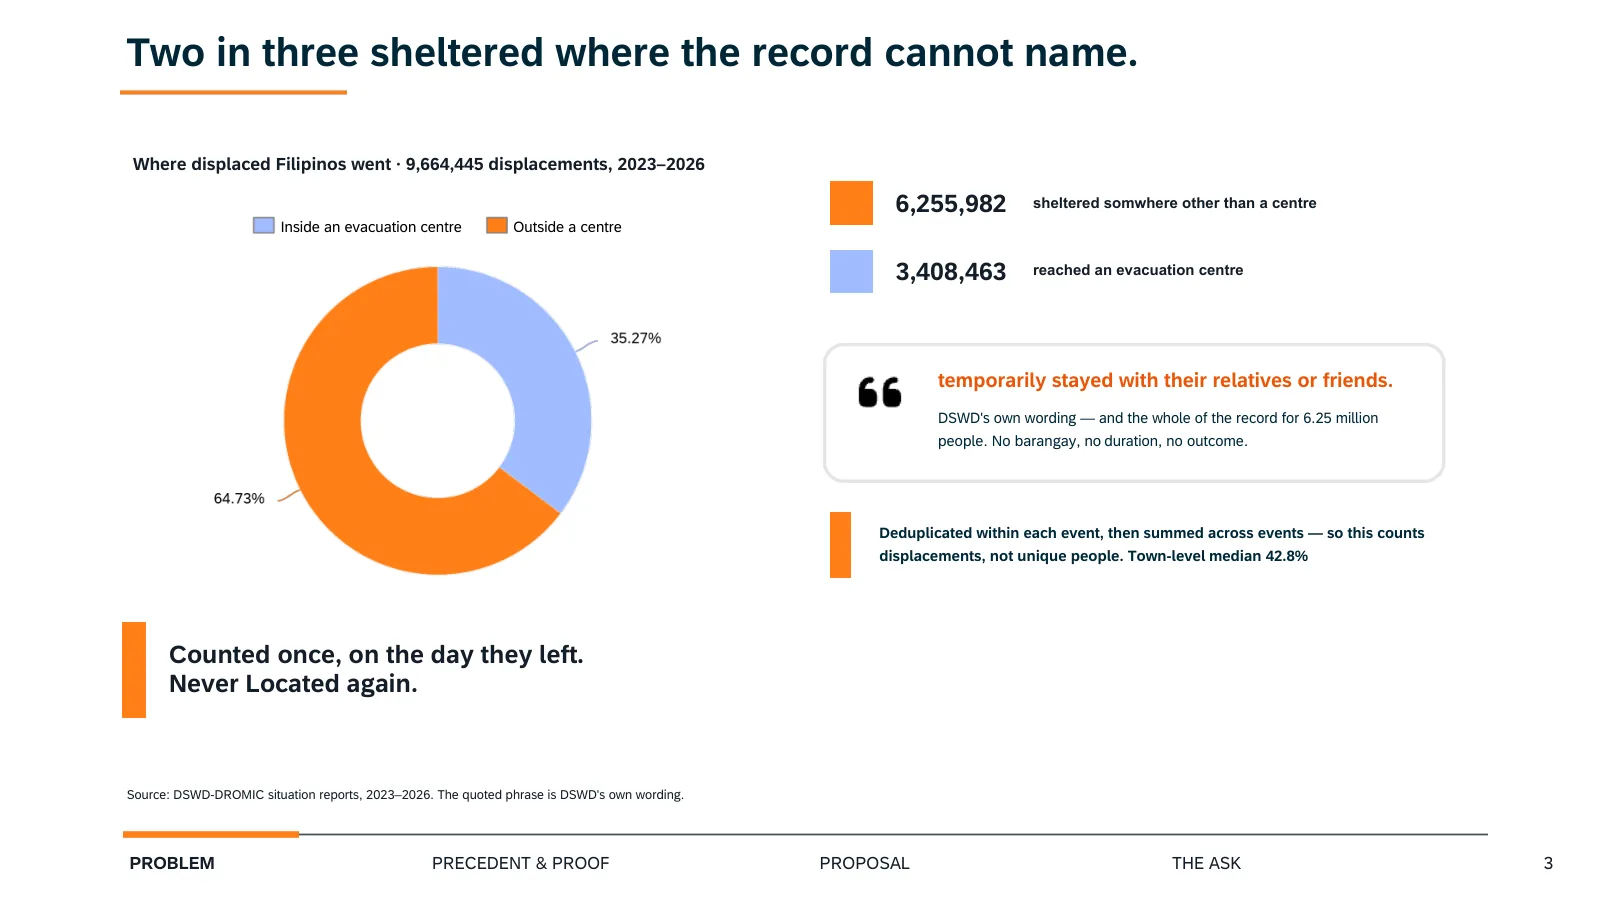
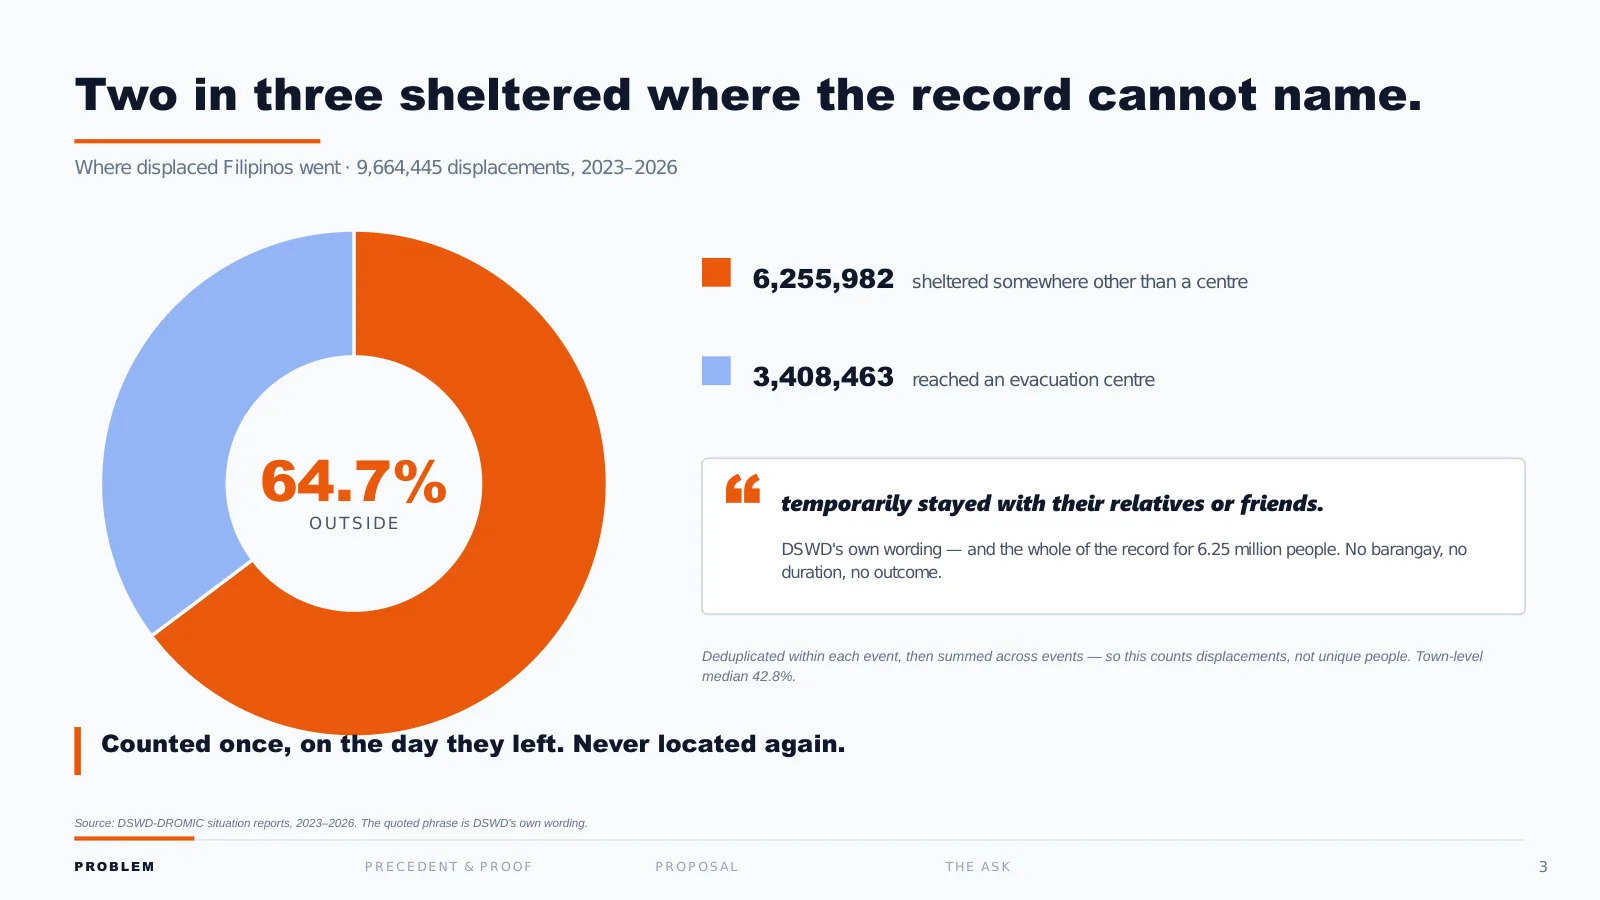
How to read it: The whole bar is every displacement from 2023 to 2026. Someone displaced twice counts twice. The blue part ended somewhere other than an evacuation centre: about two in every three.
Here is what happens when you do count. Three years of Philippine records, every event, every town: 9.6 million displacements, and two in every three of them sheltered somewhere that is not an evacuation centre.
That is about 6.25 million. And for those people, the government’s entire record of where they went is one phrase, which the Department of Social Welfare and Development (DSWD) repeats in report after report: they “temporarily stayed with their relatives or friends.”
That sentence is the whole of the record. No barangay. No duration. No outcome. Counted once, on the day they left, and never located again.
4 · When the host network fails
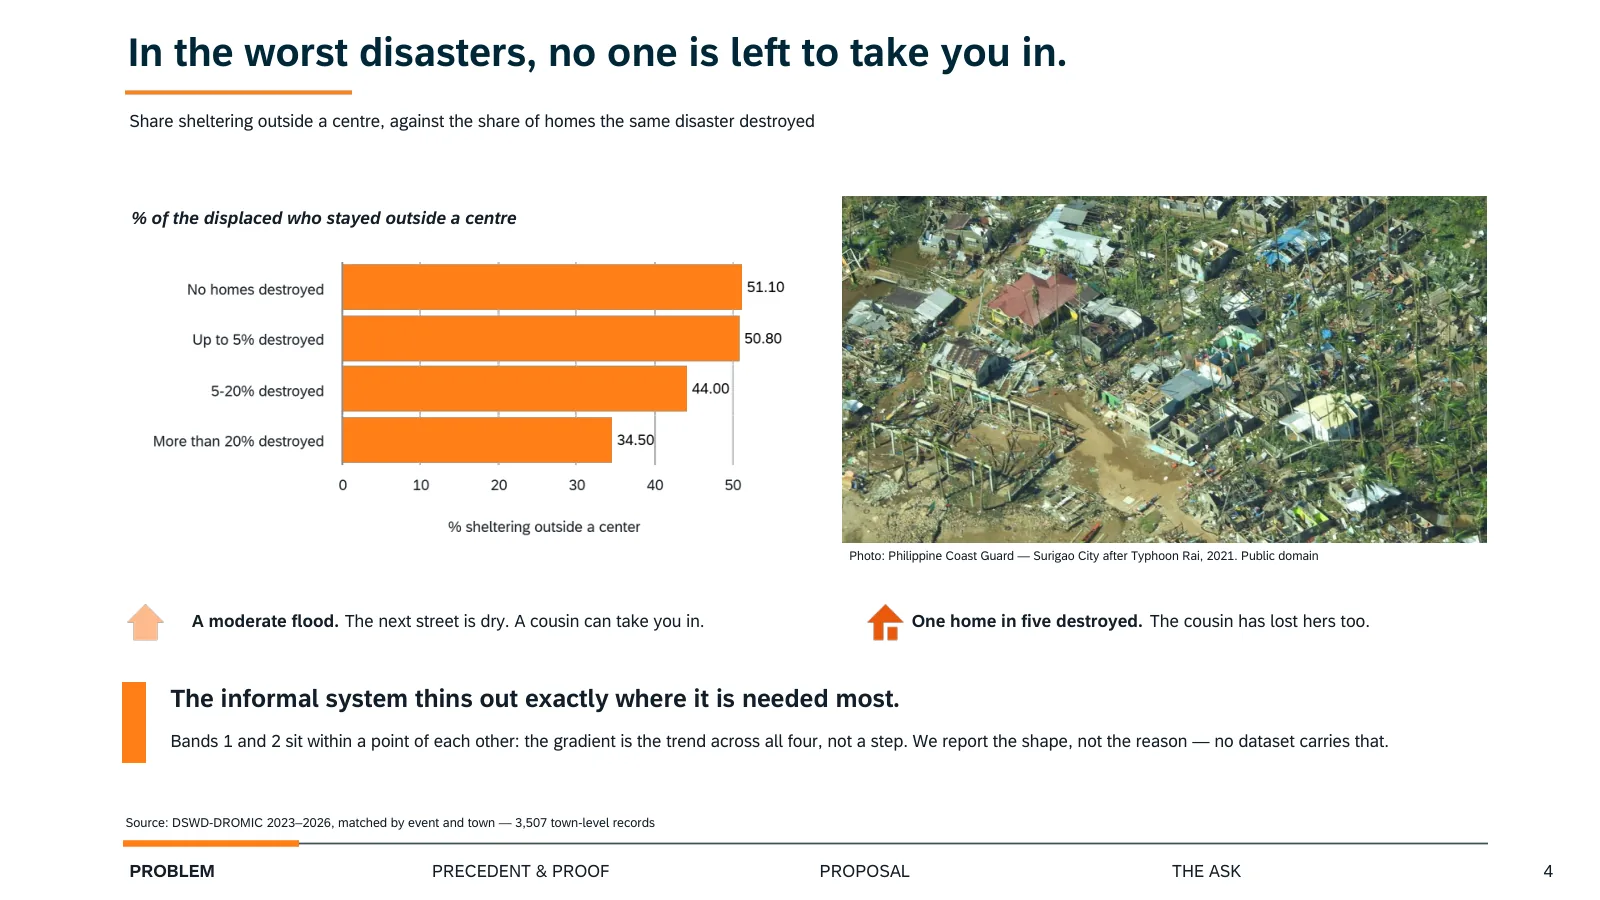
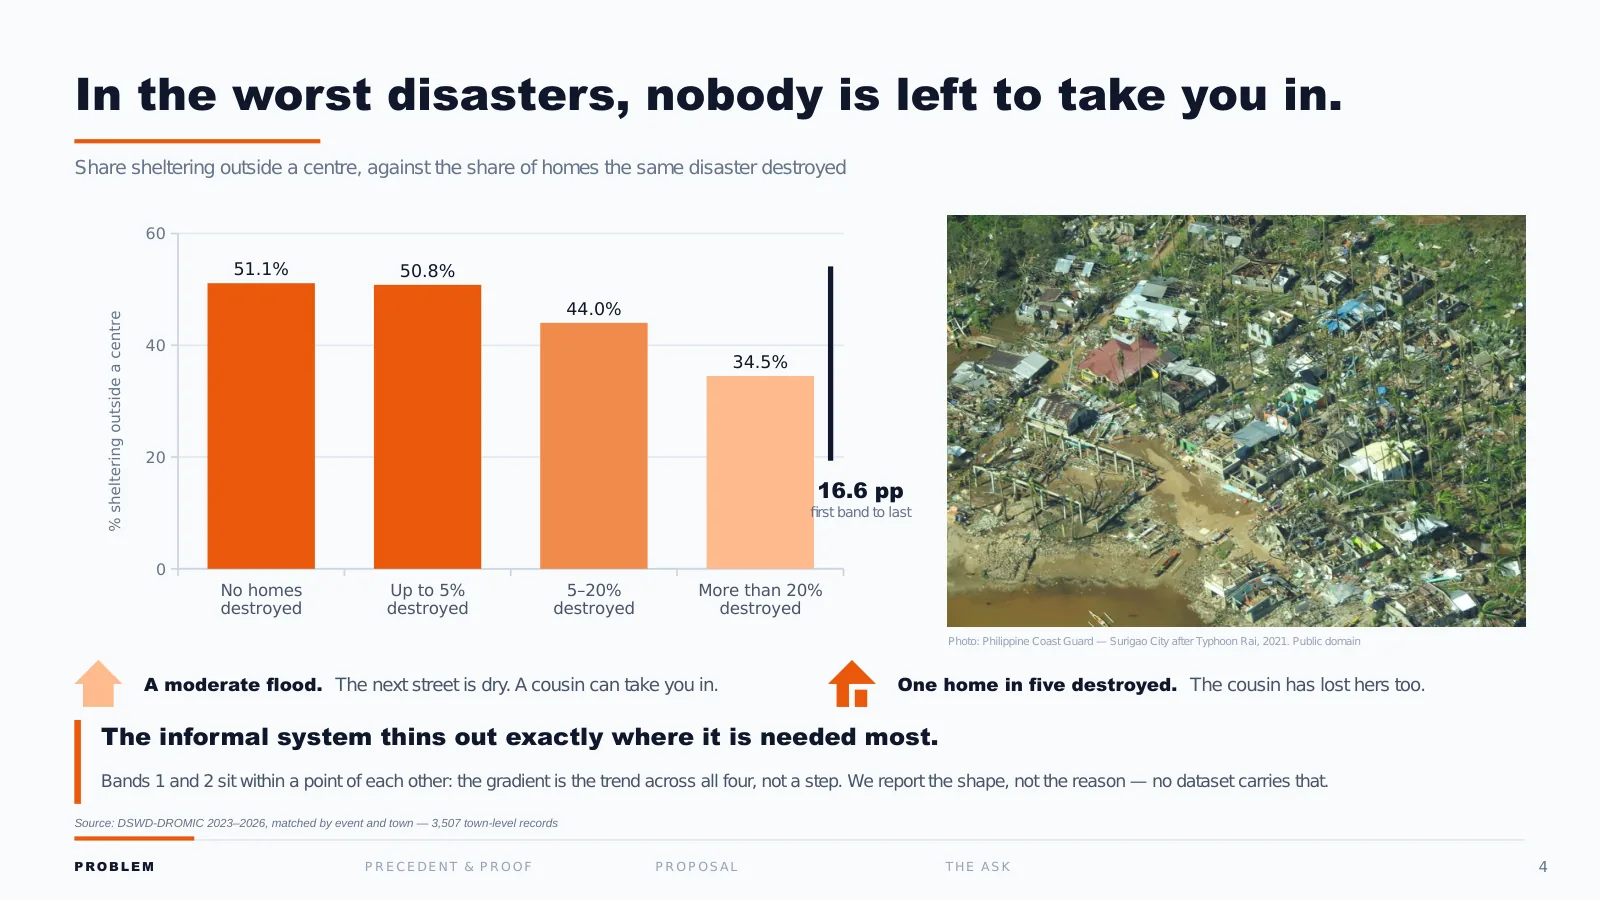
The obvious reading is that this is fine: Filipinos have family, family takes them in, the system works. So we tested it against the severity of the disaster.
Every person in this chart left home. On the left, disasters that destroyed no houses: half shelter outside a centre. On the right, disasters that destroyed more than one home in five: it falls to a third.
In a moderate flood, the next street is dry and a cousin can take you in. In a disaster that flattens one house in five, the cousin has lost hers too.
The informal system that absorbs two-thirds of our displaced thins out exactly where it is needed most, and that is the same point at which the record goes quiet. We are not claiming to know why households behave this way; no Philippine dataset answers that. We are reporting the shape.
5 · The blank space has a geography
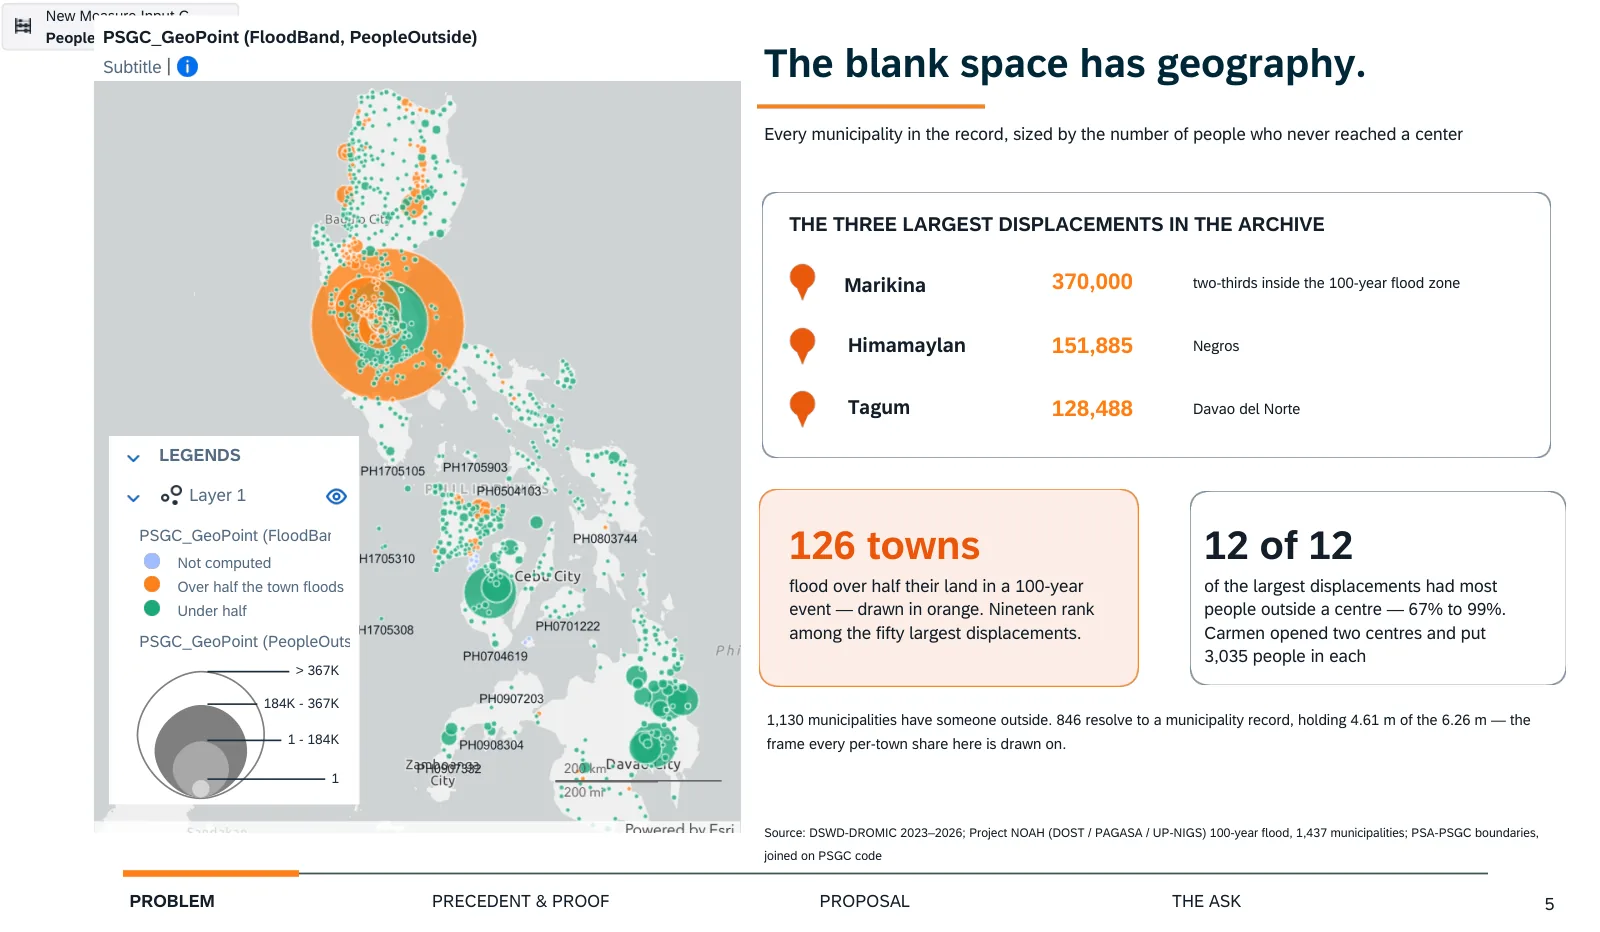
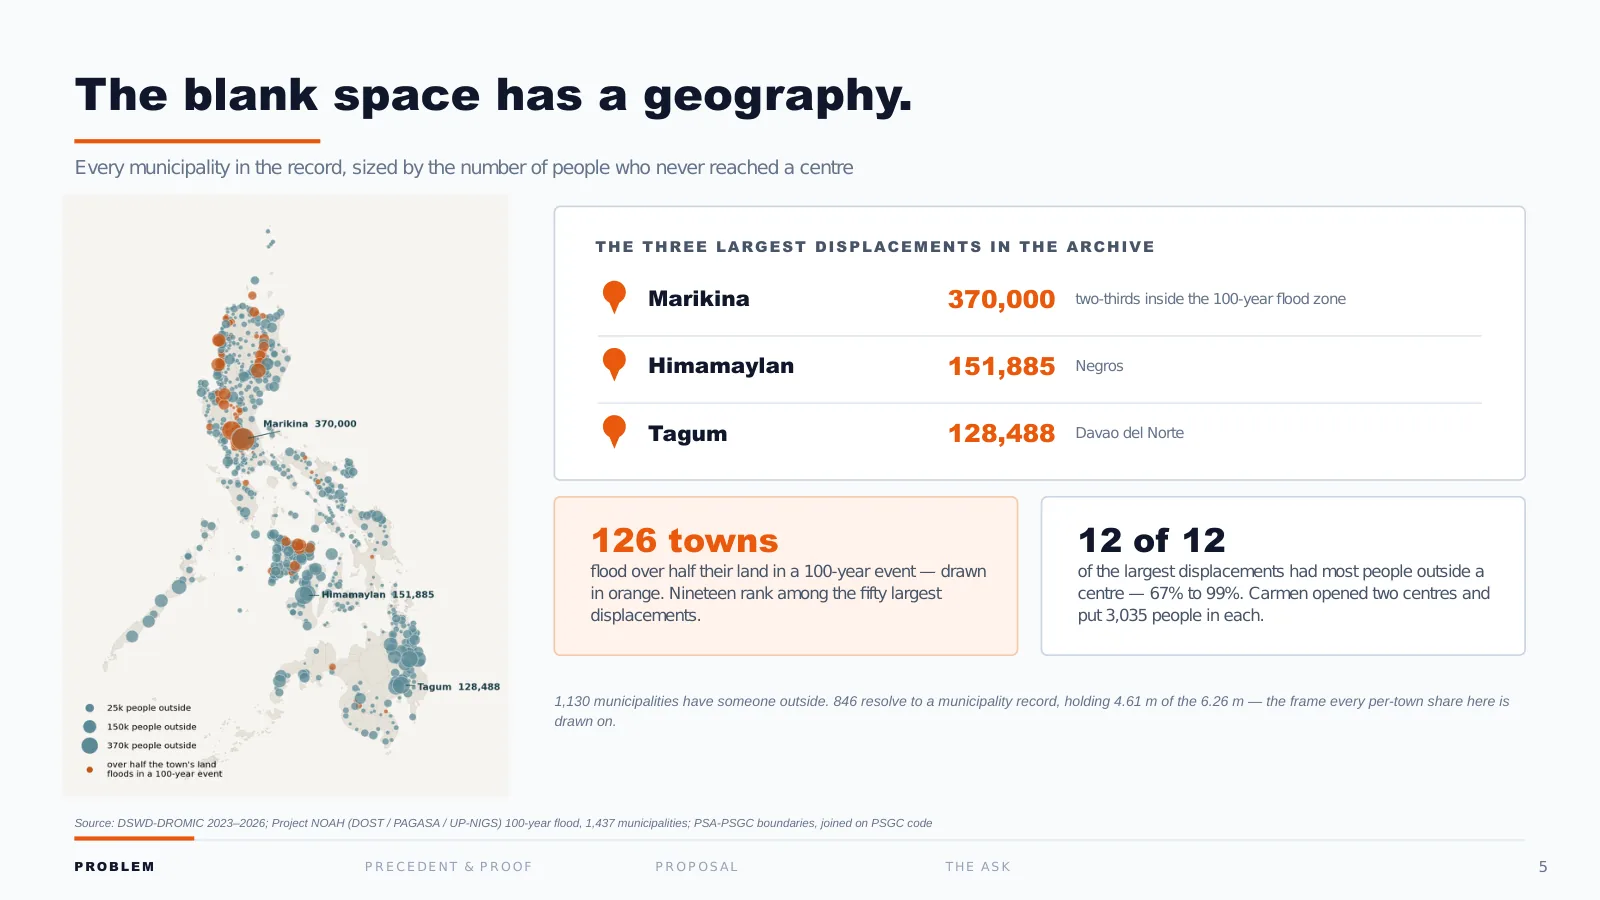
The gap is not spread evenly. Every dot is a municipality, sized by how many people never reached a centre. Marikina alone: 370,000, the largest single displacement in the archive, in a city two-thirds inside the 100-year flood zone. Himamaylan in Negros. Tagum in Davao del Norte.
The highlighted dots are the towns that flood over half their land in a 100-year event: 126 of them, and 19 rank among the country’s 50 largest displacements.
And in all 12 of the biggest displacements we found, most people never reached a centre: between 67% and 99%.
Looking back. Look at the top left of the map: SAC’s editing panel (“New Measure Input”, a “Subtitle” placeholder, the layer legend with raw town codes) went out in the export. Nobody on the team looked at the exported PDF page by page before it was uploaded. Of every page here, this is the one I’d most want back. The designed version shows the map we meant to send.
6 · The sign flips
Redrawn for readability
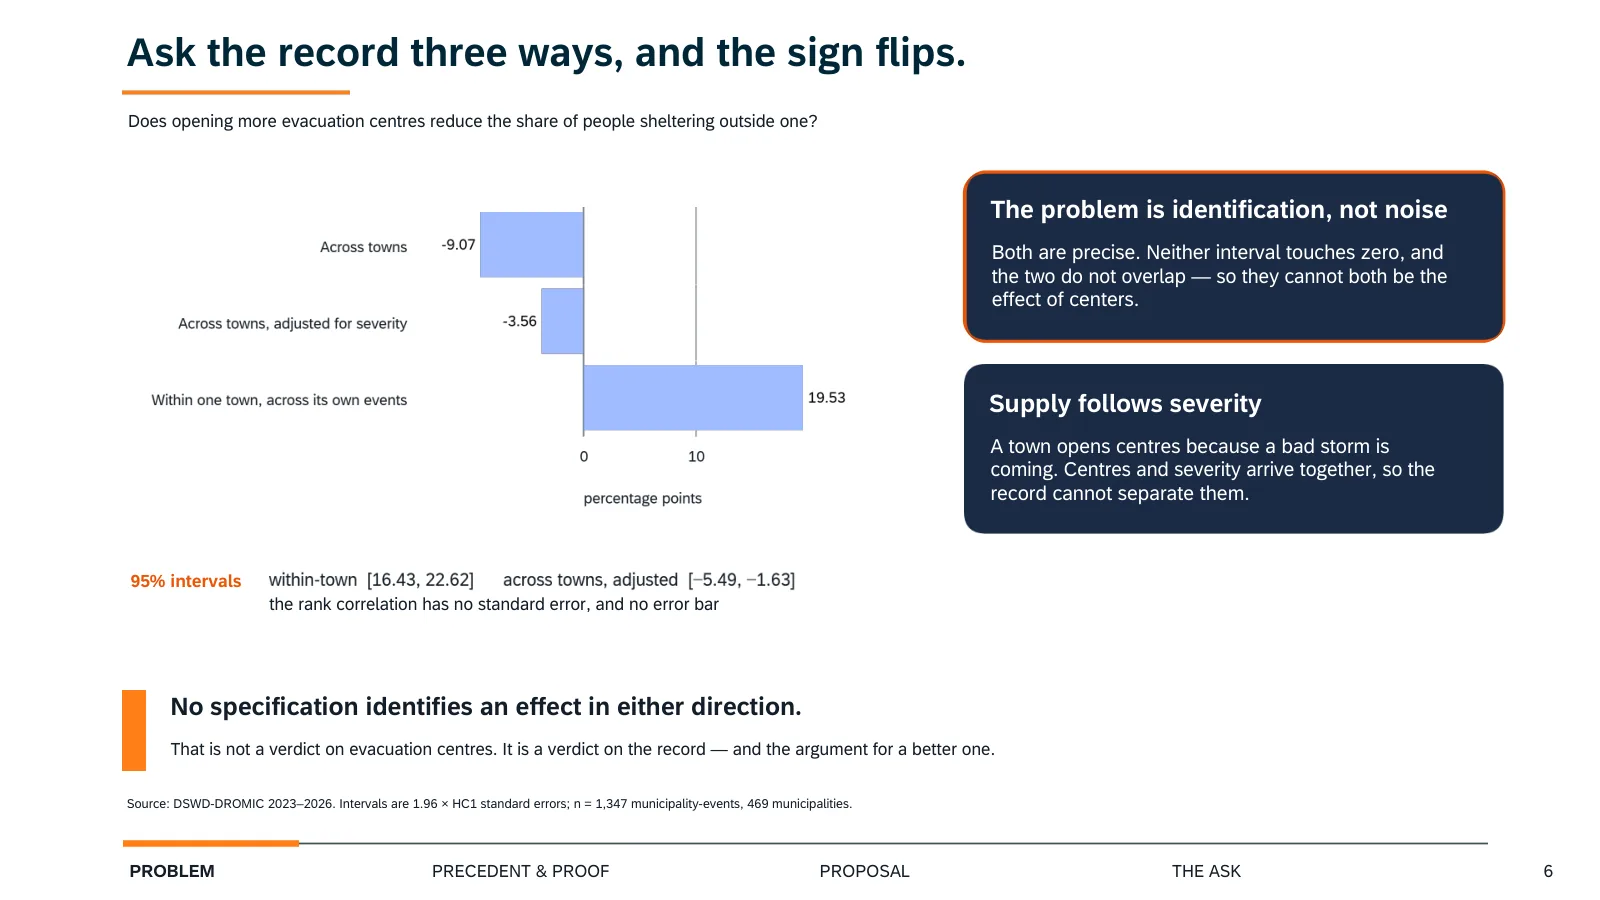
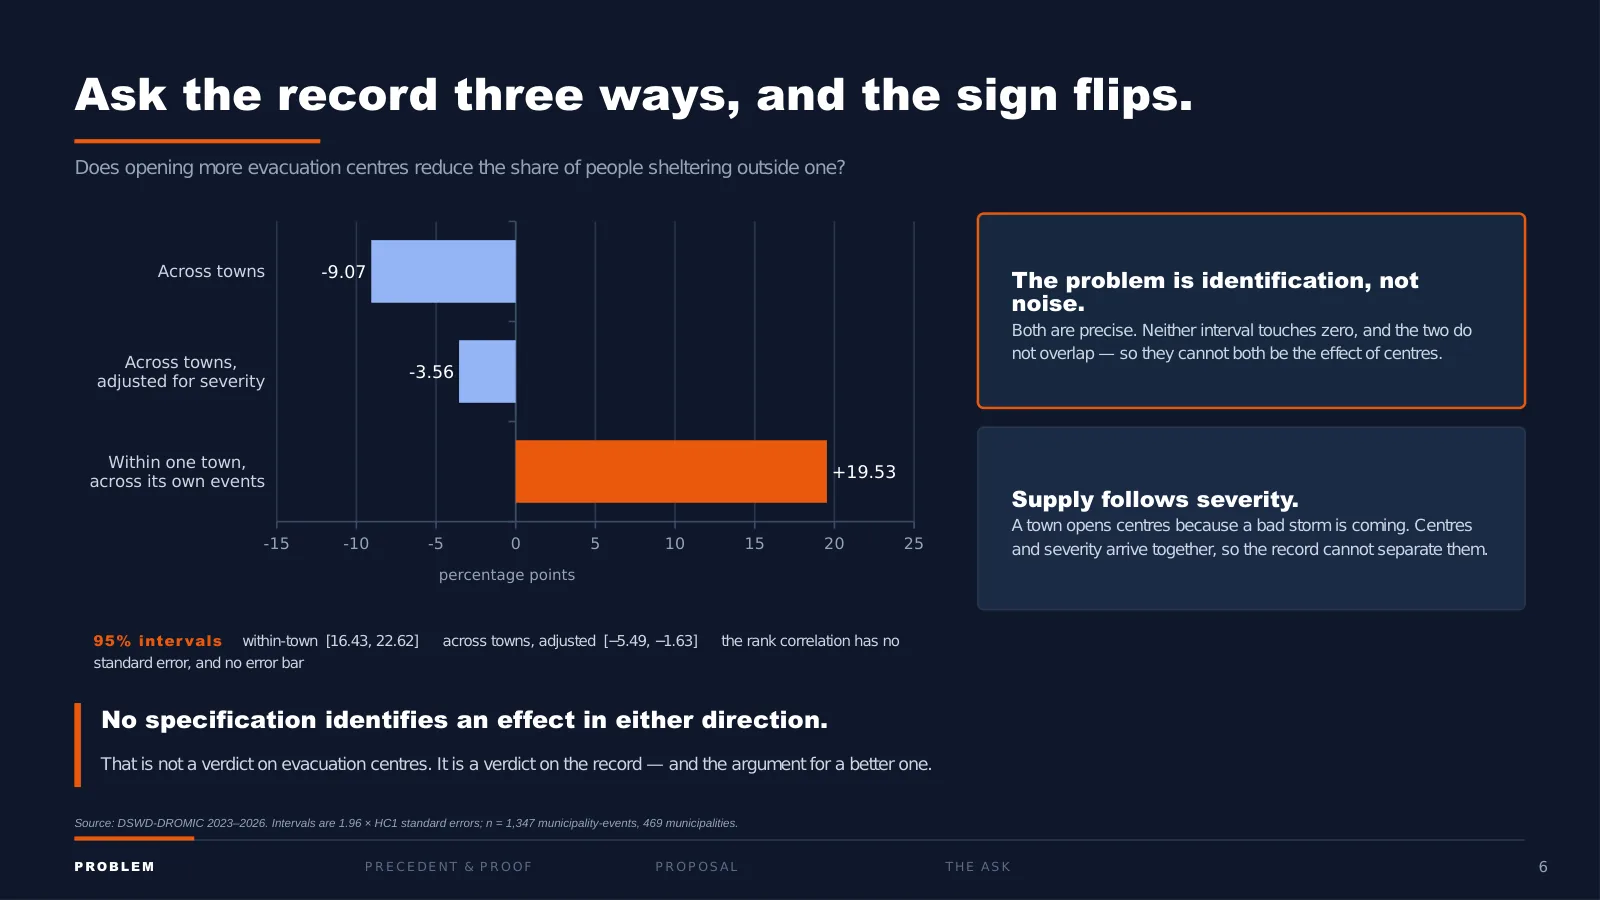
How to read it: Each dot is one way of measuring whether towns with more evacuation centres have fewer people sheltering outside. Left of zero means fewer outside; right means more. The line through a dot is the range the true value probably sits in (95% confidence). The first measure is a ranking of towns rather than points, so it has no range; read only its direction.
I want to give you our strongest objection to our own work before I give you the answer.
If more people shelter outside where there are fewer centres, the fix is obvious: build more centres. So we tested that three ways, and here is what came back.
Comparing towns, more centres looks like fewer people outside, by 9 points. Adjust for severity, still negative. But follow one town across its own events, and the sign flips: 19.5 points more.
Those last two estimates are precise. Neither confidence interval comes near zero, and the two do not overlap. They are not noisy; they are contradictory, and for a reason. A town opens centres because a bad storm is coming. The centres and the severity arrive together, so the data cannot separate them.
Our conclusion is deliberately narrow. No specification identifies an effect in either direction. We are not telling you centres don’t work. We are telling you this record cannot answer the question, which is itself the argument for a better record.
7 · The money
Redrawn for readability
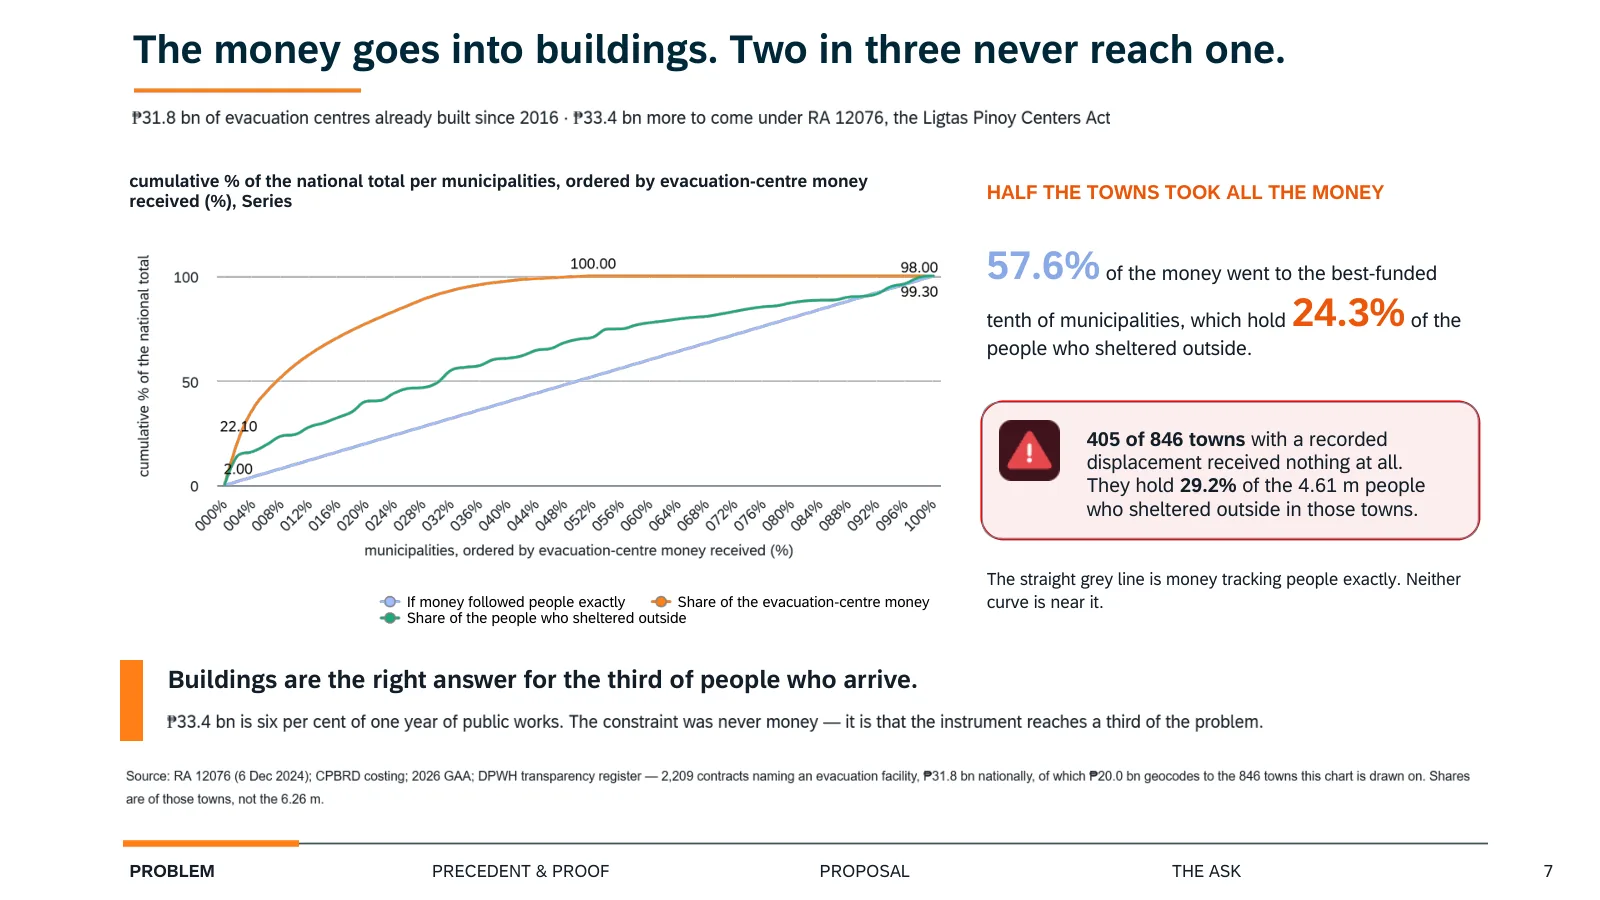
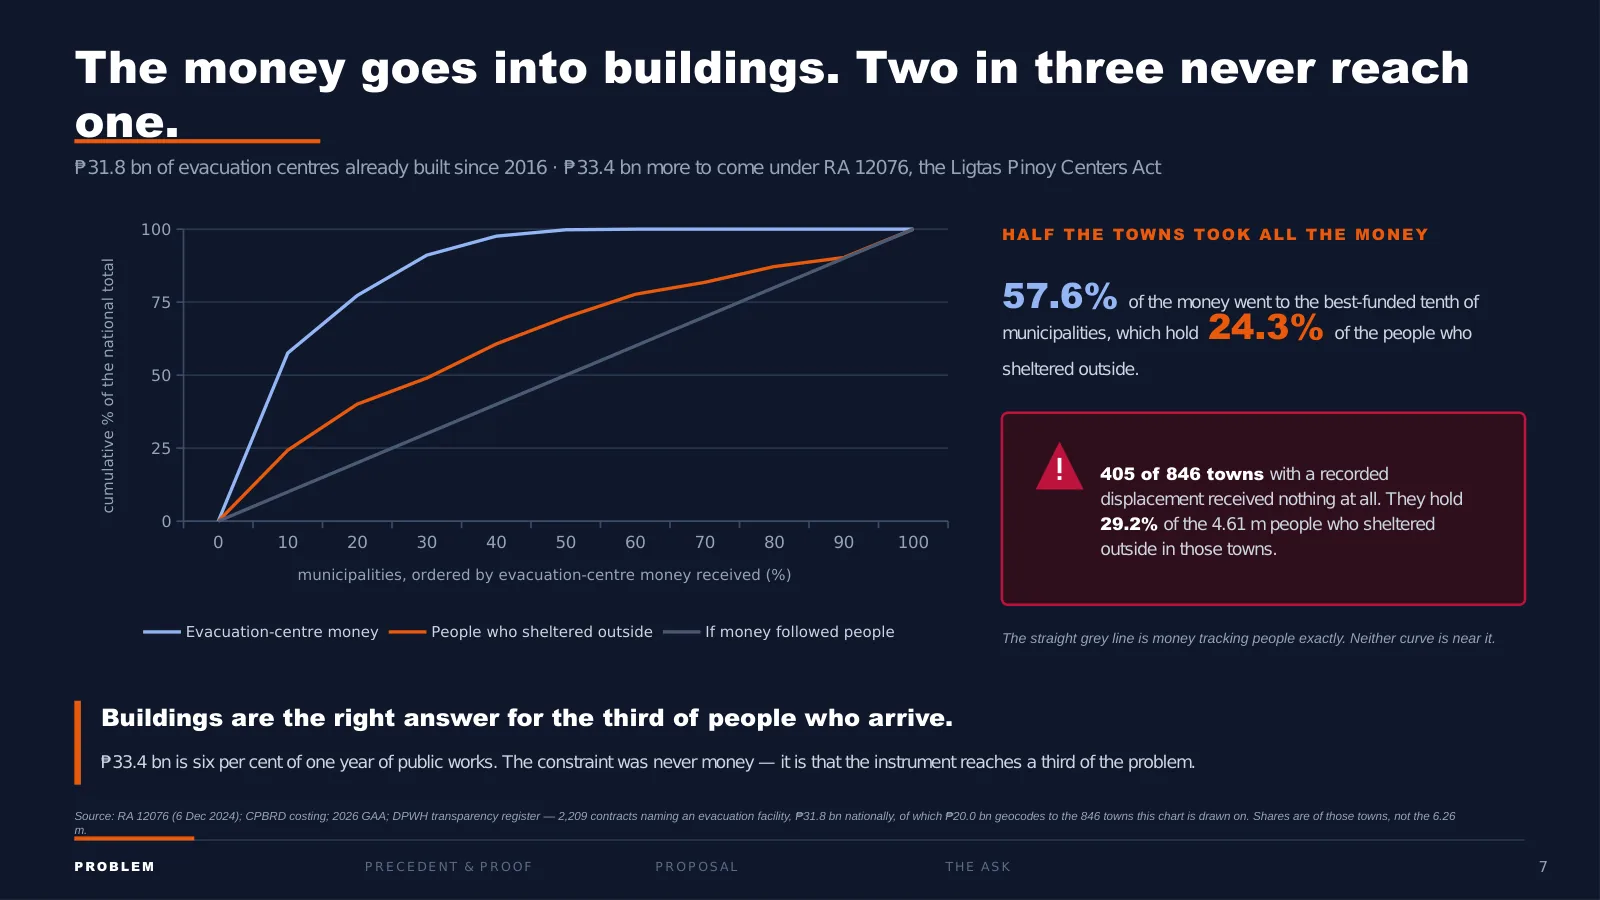
How to read it: Both bars describe the same towns: the best-funded tenth. If money followed people, the two bars would be the same length.
Meanwhile the money has already been committed. Republic Act (RA) 12076, signed in December 2024: PHP 33.4 billion for about 515 evacuation centres.
We traced where PHP 31.8 billion of centres already built actually went, contract by contract, and plotted it against where the people are. The orange line is the money. The green line is the people who sheltered outside. The straight line is what it would look like if money followed people.
By the halfway point the money is all gone, while those same towns hold only about 70% of the people who sheltered outside. The best-funded tenth of towns took 57.6% of the money. And 405 of the 846 towns with a recorded displacement received nothing at all.
To be fair to the law: buildings are the right answer for the third of people who arrive. And PHP 33.4 billion is 6% of one year of public works, so the constraint was never money. It is that the instrument reaches a third of the problem.
Looking back. Some towns were counted twice on this page, under two spellings of their names. The headline held, but one count on the slide was too high. We found it on the deadline day and fixed it in the data afterwards; the slide is shown as submitted. See Appendix B.
8 · What can be forecast
One more thing the record can do, and one thing it cannot.
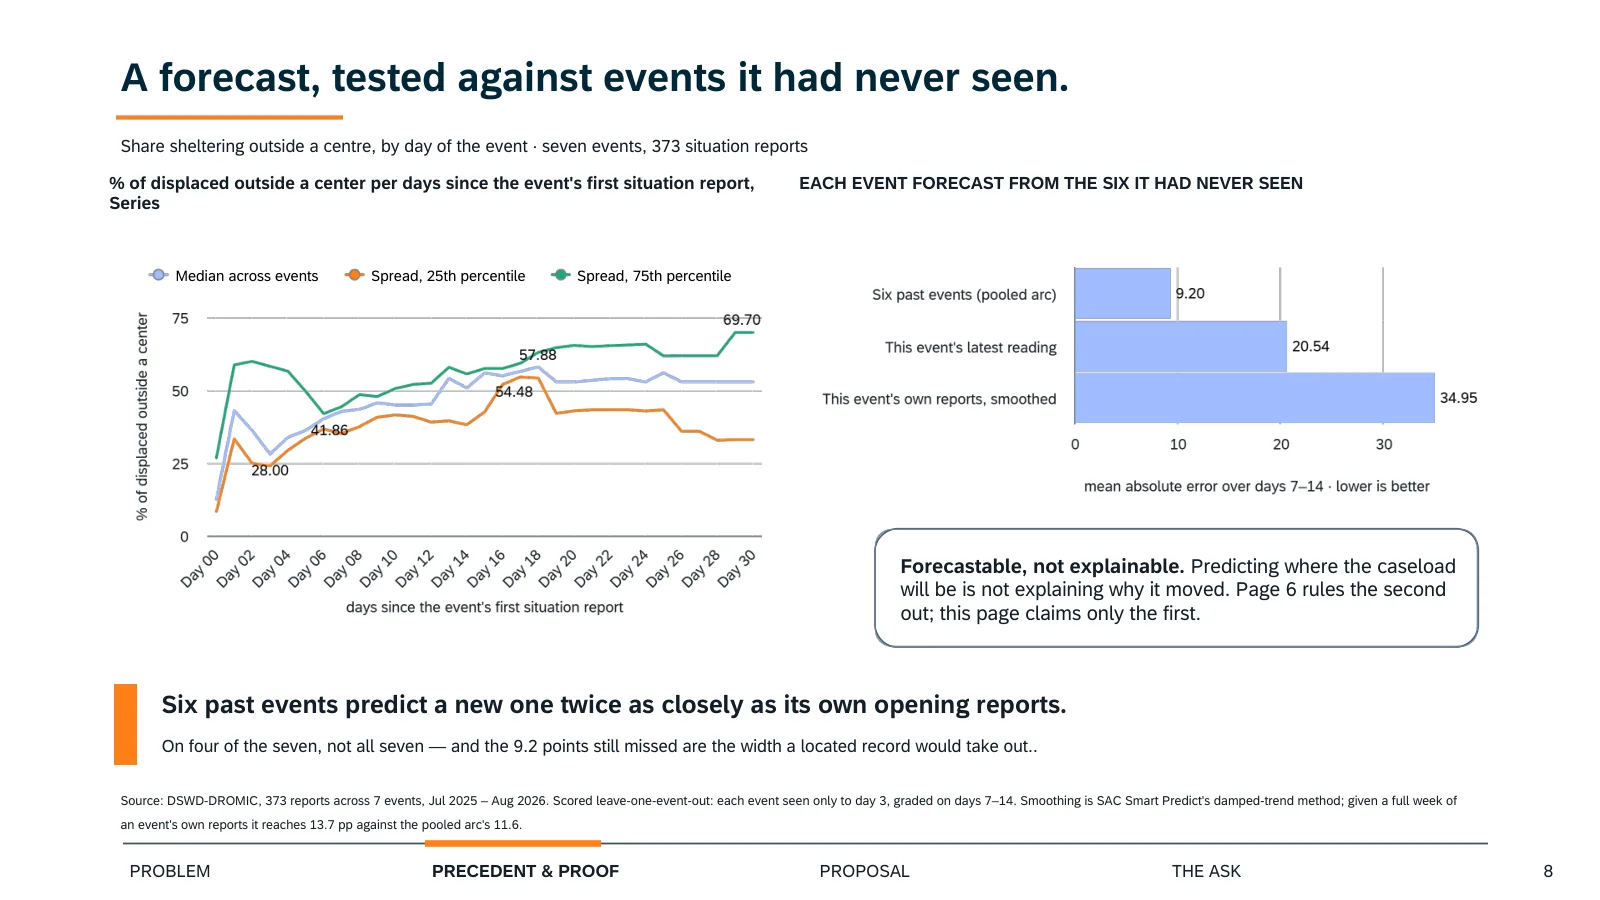
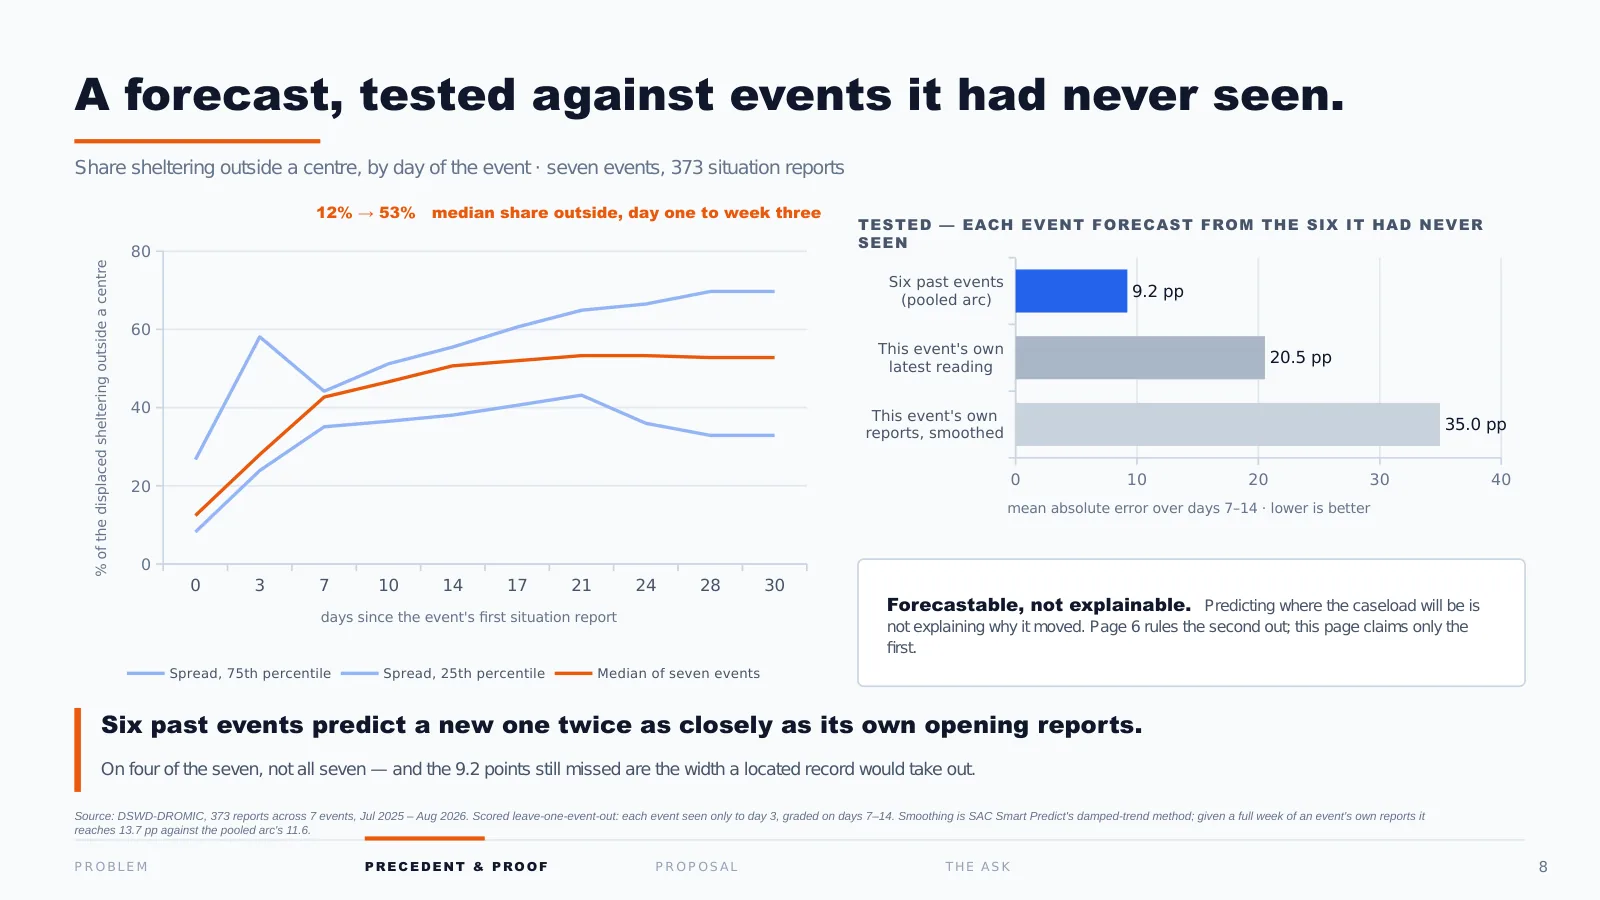
Follow a single event day by day and the share of people sheltering outside a centre climbs, from about 12% on the first day to a little over half by week three. That is a forecastable shape.
Now the honest part, and I would rather say it than have you ask. This is fitted on seven events. The line is the median across them; the band is the actual spread, and by week three that band is 22 points wide. That is not a precise instrument.
But the width is the finding. Twenty-two points is what you can forecast from a record that counts people and never locates them. A located record is what narrows it, which is exactly what we are proposing.
And note what this page does not say. Predicting where the caseload will be is not the same as explaining why it moved there. Page 6 ruled the second one out. This only claims the first.
Looking back. This is a good page in the wrong deck. By page 8 we had made our point, and this page opened a sixth idea. The judges called the storyboard too broad, and this is where it started. I would cut it and spend the space on making pages 3 to 7 readable.
9 · The missing column
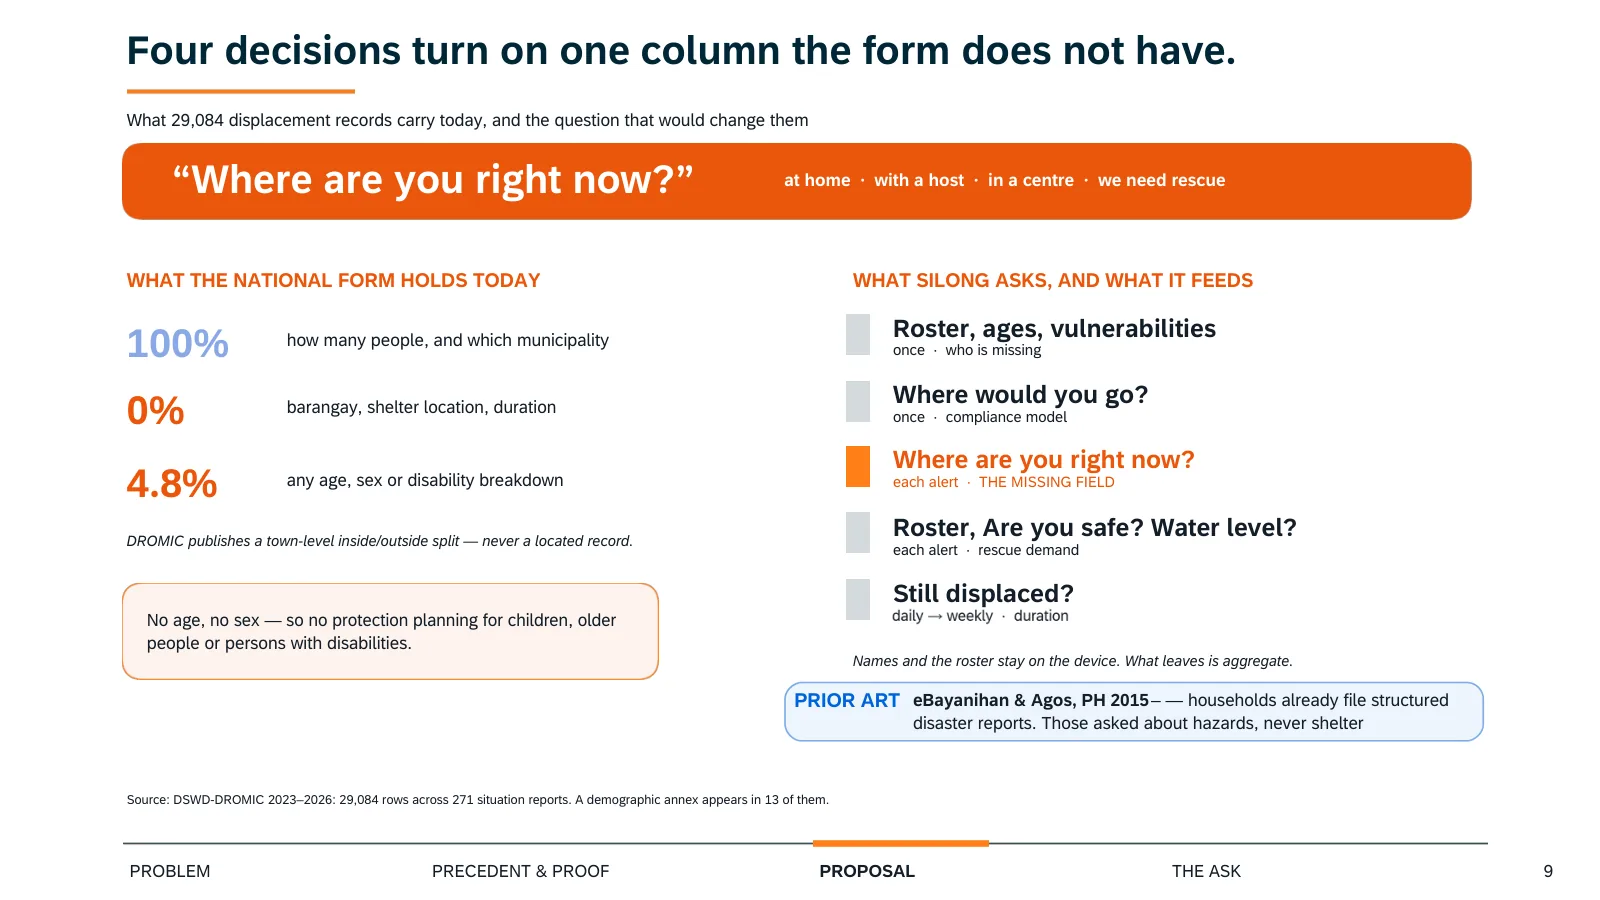
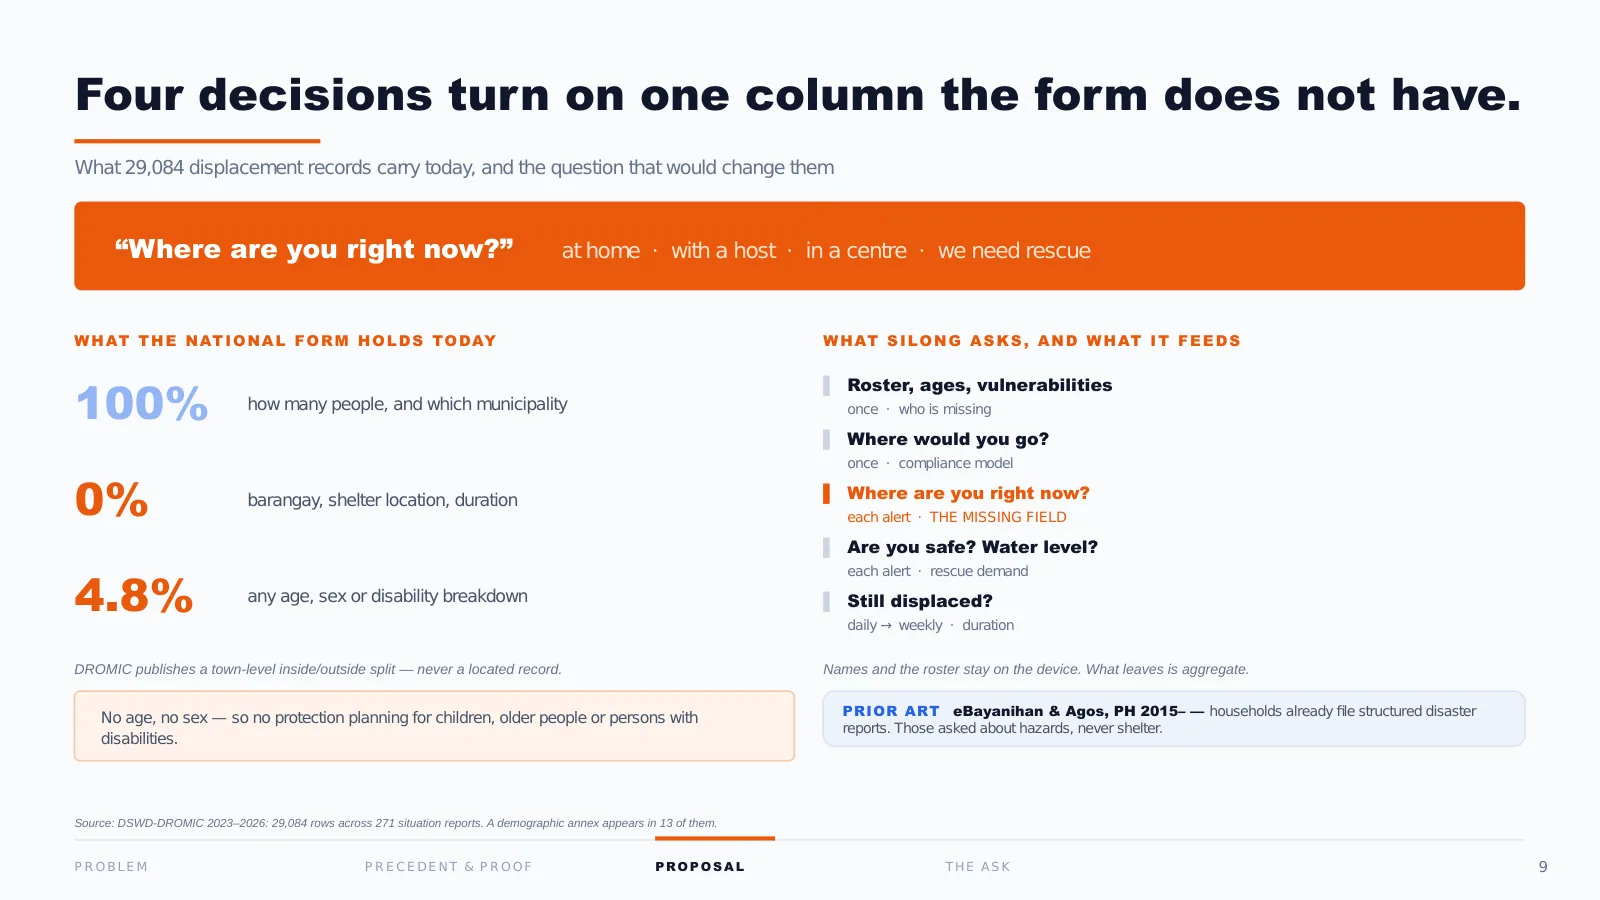
This is what the national form holds today. How many people, and which municipality: 100% of the time. Barangay, shelter location, duration: zero.
To be precise, because these two pages could look like they disagree: DSWD’s Disaster Response Operations Monitoring and Information Center (DROMIC) does publish a town-level inside-outside split, which is where our two-thirds came from. What it has never published is a located record. A number, not a place.
And one more, which matters more than it looks: of 271 situation reports, 13 carry any breakdown by age, sex or disability. That is 4.8%. With no age and no sex, there is no protection planning: not for children, not for older people, not for persons with disabilities.
Our proposal is one question, asked of the household, at the moment only the household can answer it. Where are you right now? Four buttons. At home, with a host, in a centre, we need rescue.
10 · What it changes
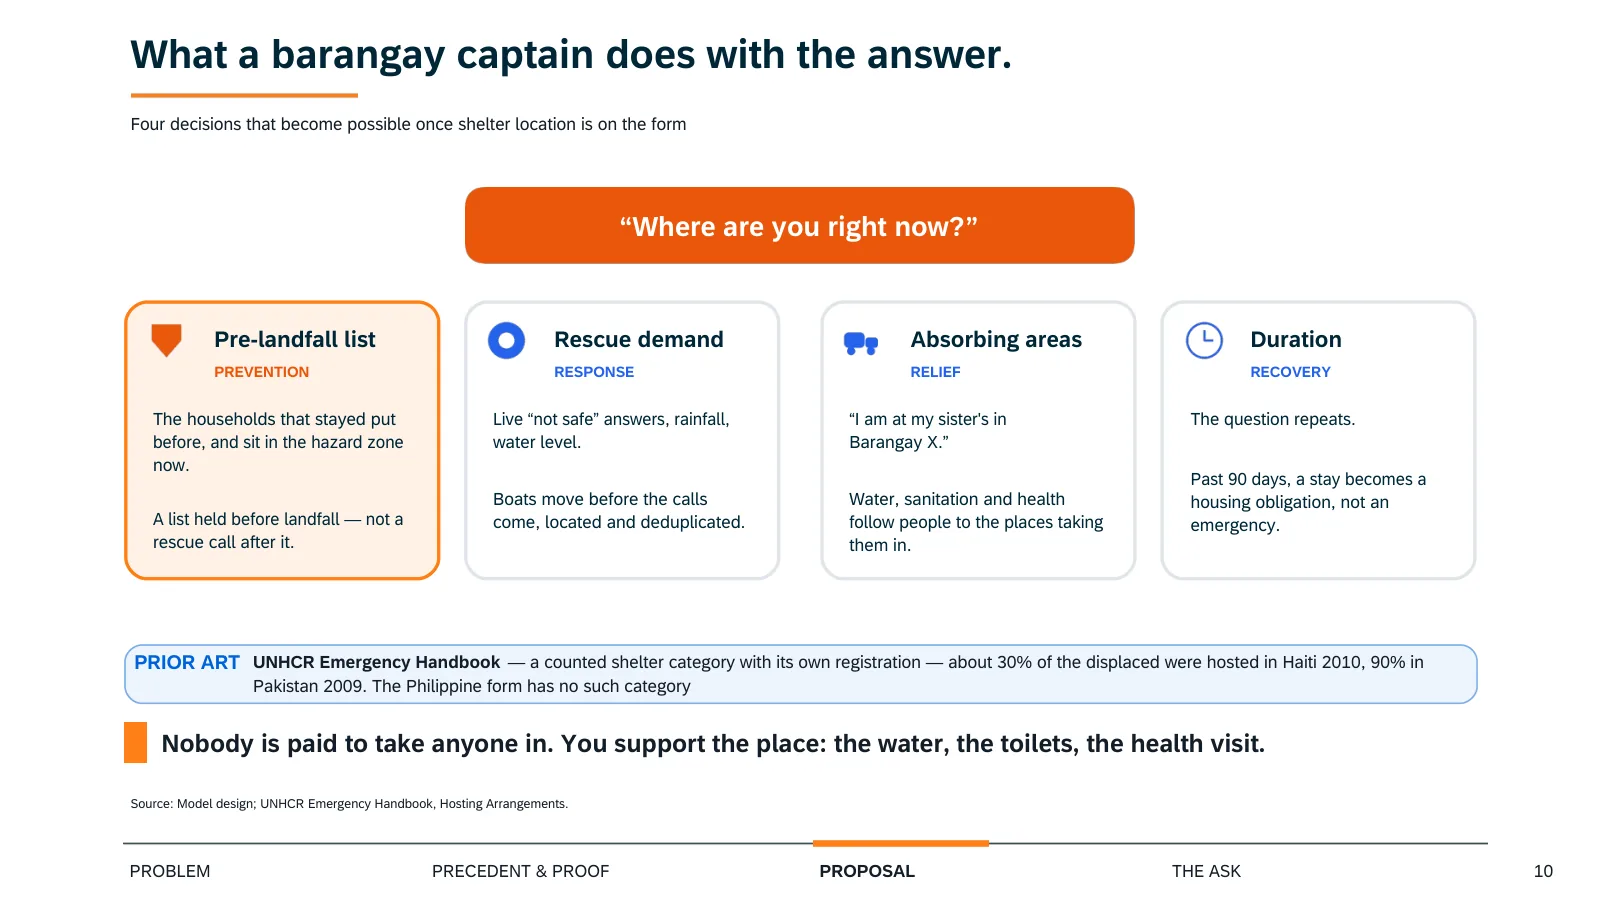
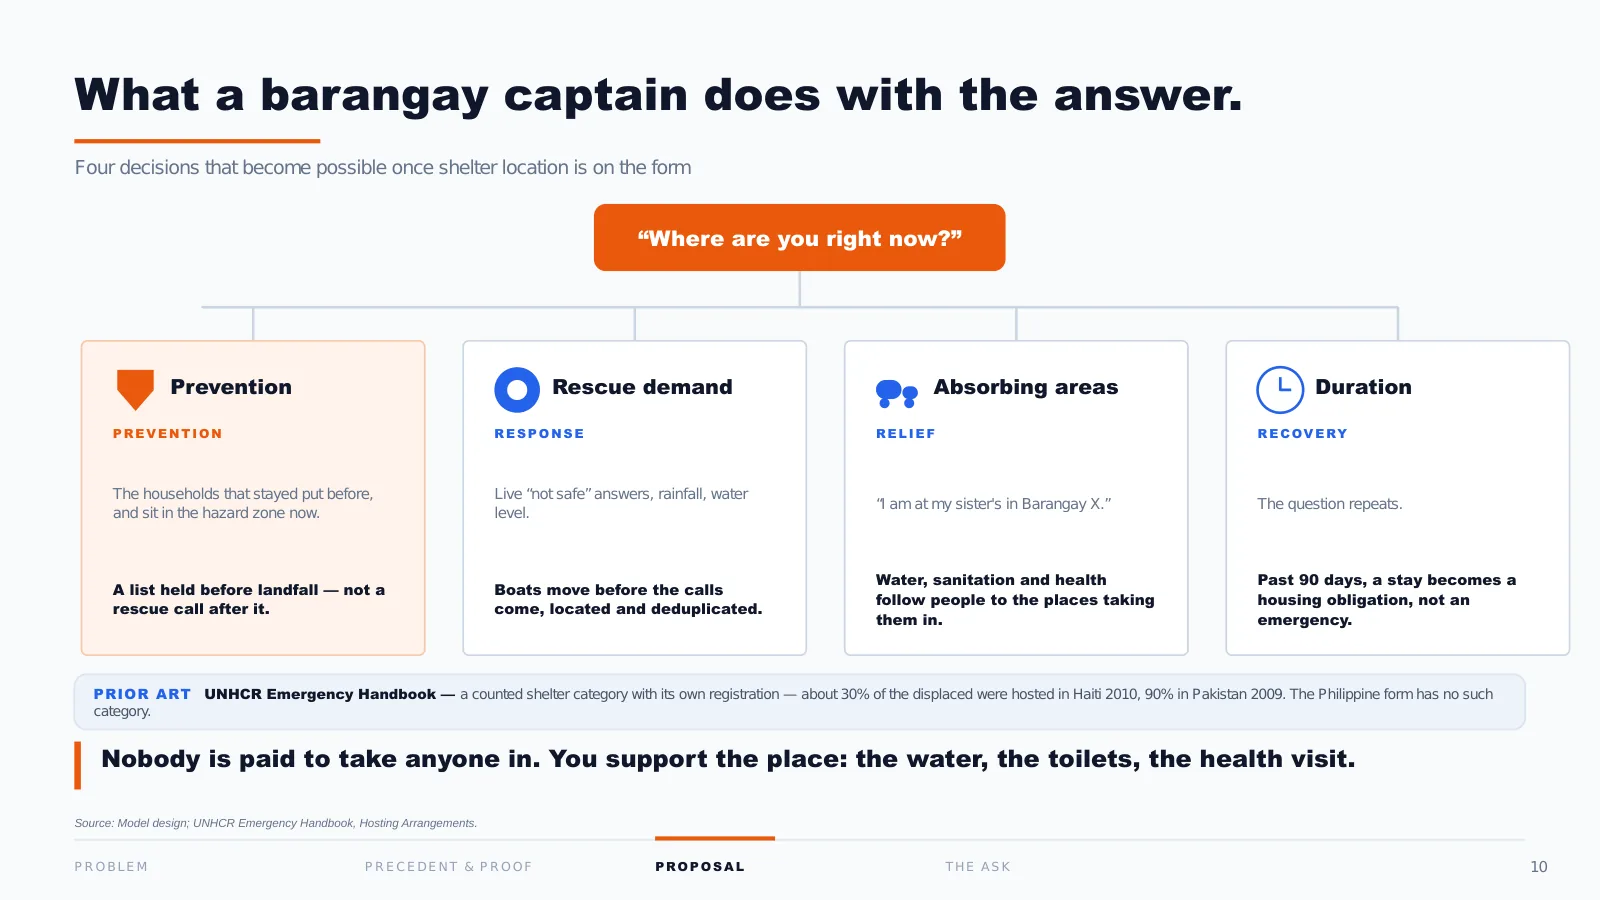
A question is not a solution, so here is what a barangay captain does with the answer.
One: the households that stayed put in previous events and sit in the hazard zone now. That is a list held before landfall, instead of a rescue call after it.
Two: rescue demand. Boats move before the calls come, and requests arrive located and de-duplicated.
Three, and this is the two-thirds: inflow. “I am at my sister’s in Barangay X.” Water, sanitation and health follow people to the places taking them in. And this is not us inventing a category: the UN Refugee Agency (UNHCR) already treats hosting as its own shelter type.
Four: because the question repeats, duration becomes measurable. Past 90 days, a stay stops being an emergency and becomes a housing obligation.
One honest limit: households that answer an app are not the households that ignore an evacuation order. That bias runs in the direction that matters most, so we correct it the way the Philippine Statistics Authority (PSA) corrects census undercount: an enumeration sweep that visits the people who never answered.
11 · The prototype
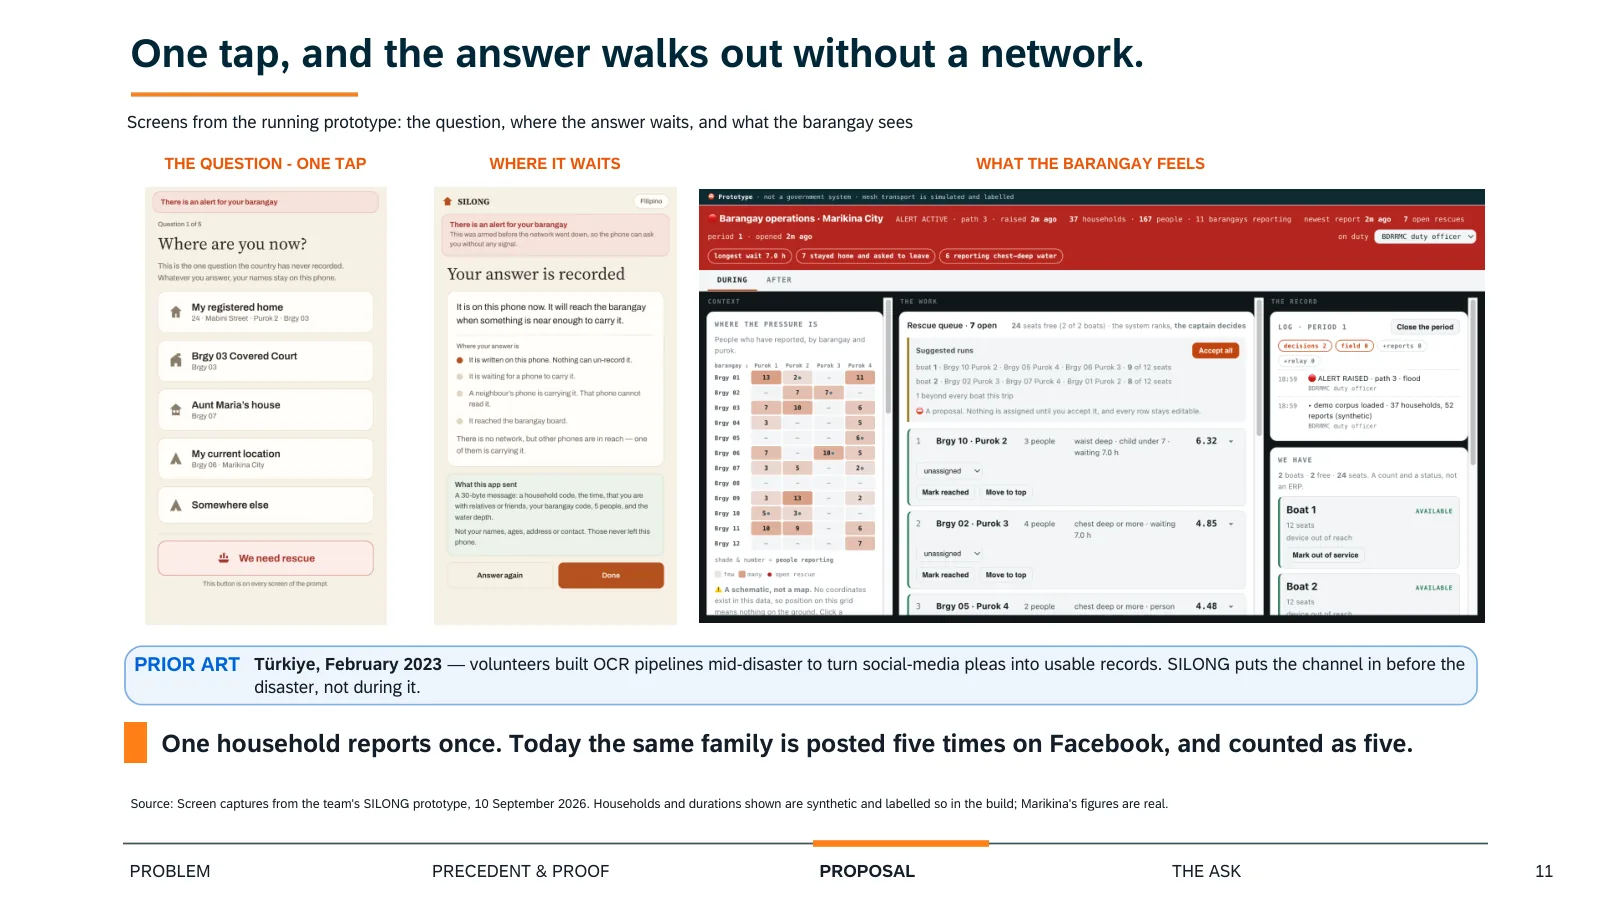
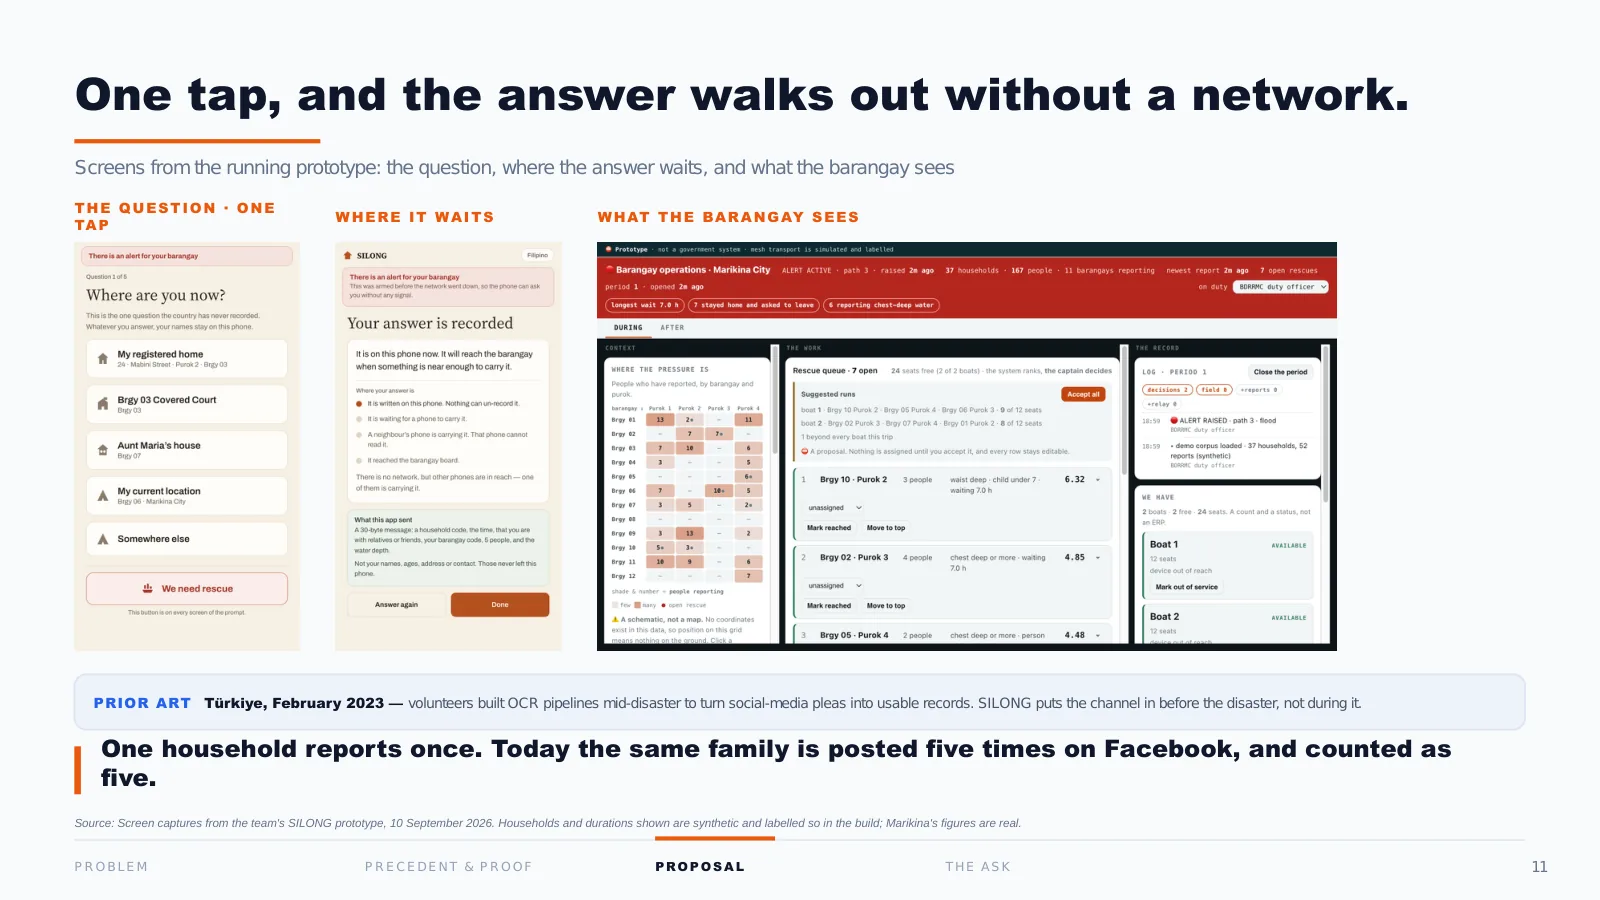
Registered once, before anything happens. When the alert fires: four buttons, one tap, no typing.
And critically, no signal required. The answer hops phone to phone over Bluetooth and waits on whichever device it reaches until one of them finds a network.
On the right is what the barangay sees: the four states live, and a rescue queue the system ranks and the captain overrides, with every override recorded.
The least glamorous benefit is the first to arrive: one household reports once.
Looking back. The prototype is real and it works, but I built most of it in the week the deadline was extended, while the storyboard waited. The pages a judge actually reads needed that week more than this screen did.
12 · How it rolls out
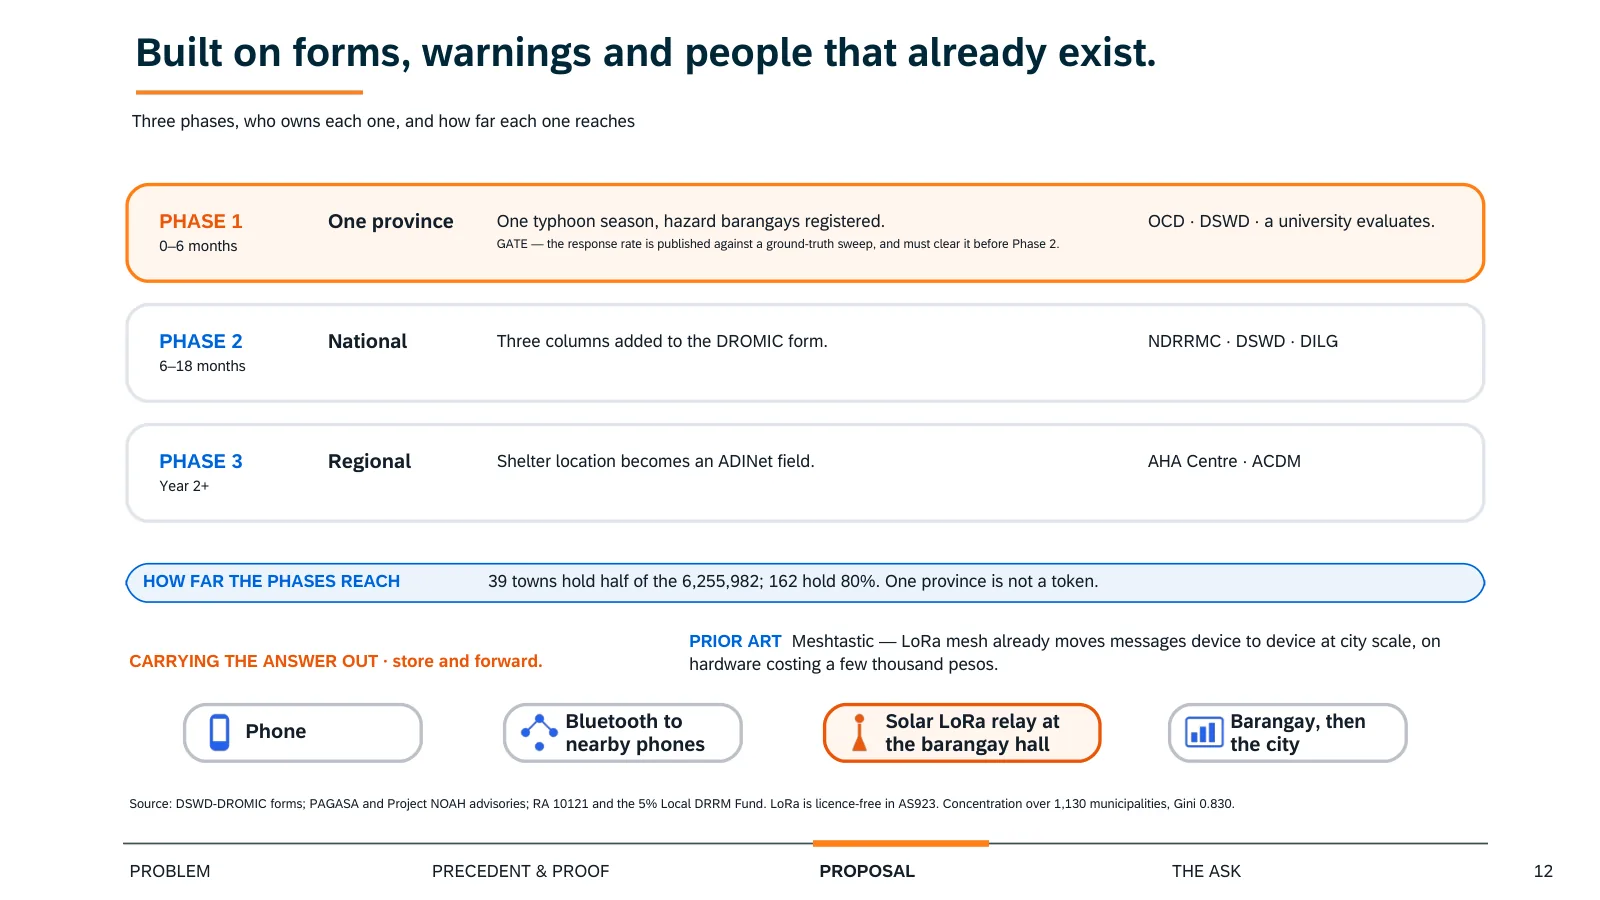
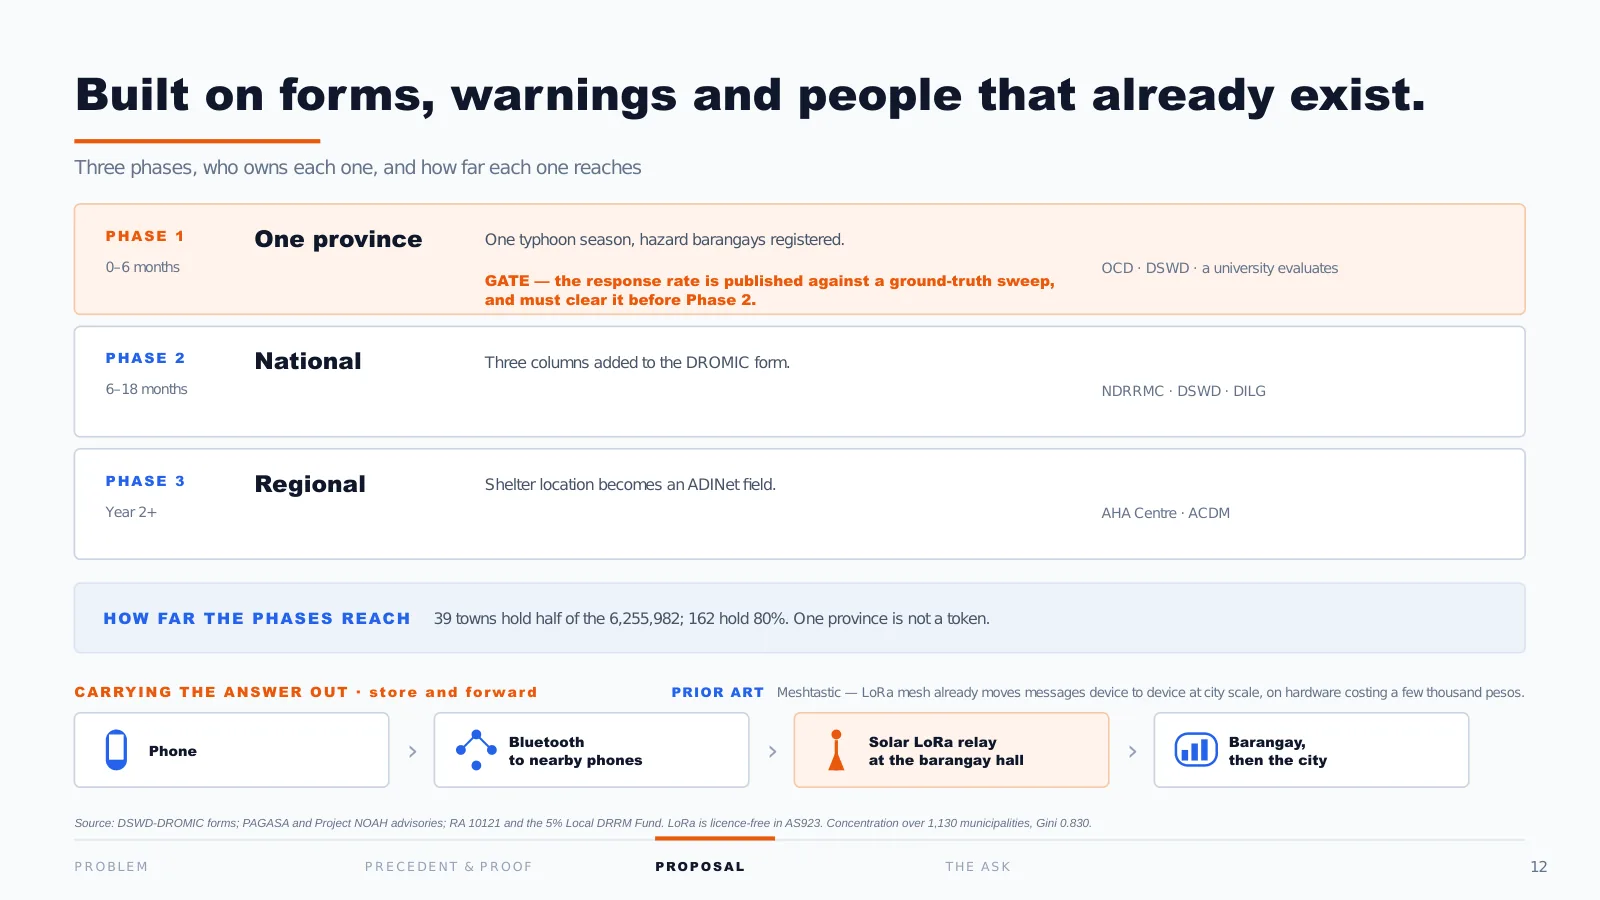
Nothing here needs a new institution. Phase one, one province, six months: register households in hazard barangays and run the question through one live typhoon season. The Office of Civil Defense (OCD) leads, DSWD owns the form, a university evaluates.
And phase one has a gate, not a promise: we publish the response rate against a ground-truth sweep, and it has to clear that before anything goes national.
Phase two adds three columns to the DROMIC form. Phase three, from year two, takes the field to ADINet.
On reach: 39 towns hold half of the 6.25 million. One province is not a token, and going national is not 1,130 separate rollouts.
13 · Why not just build
One more objection, and it is the fair one: why not simply build enough centres?
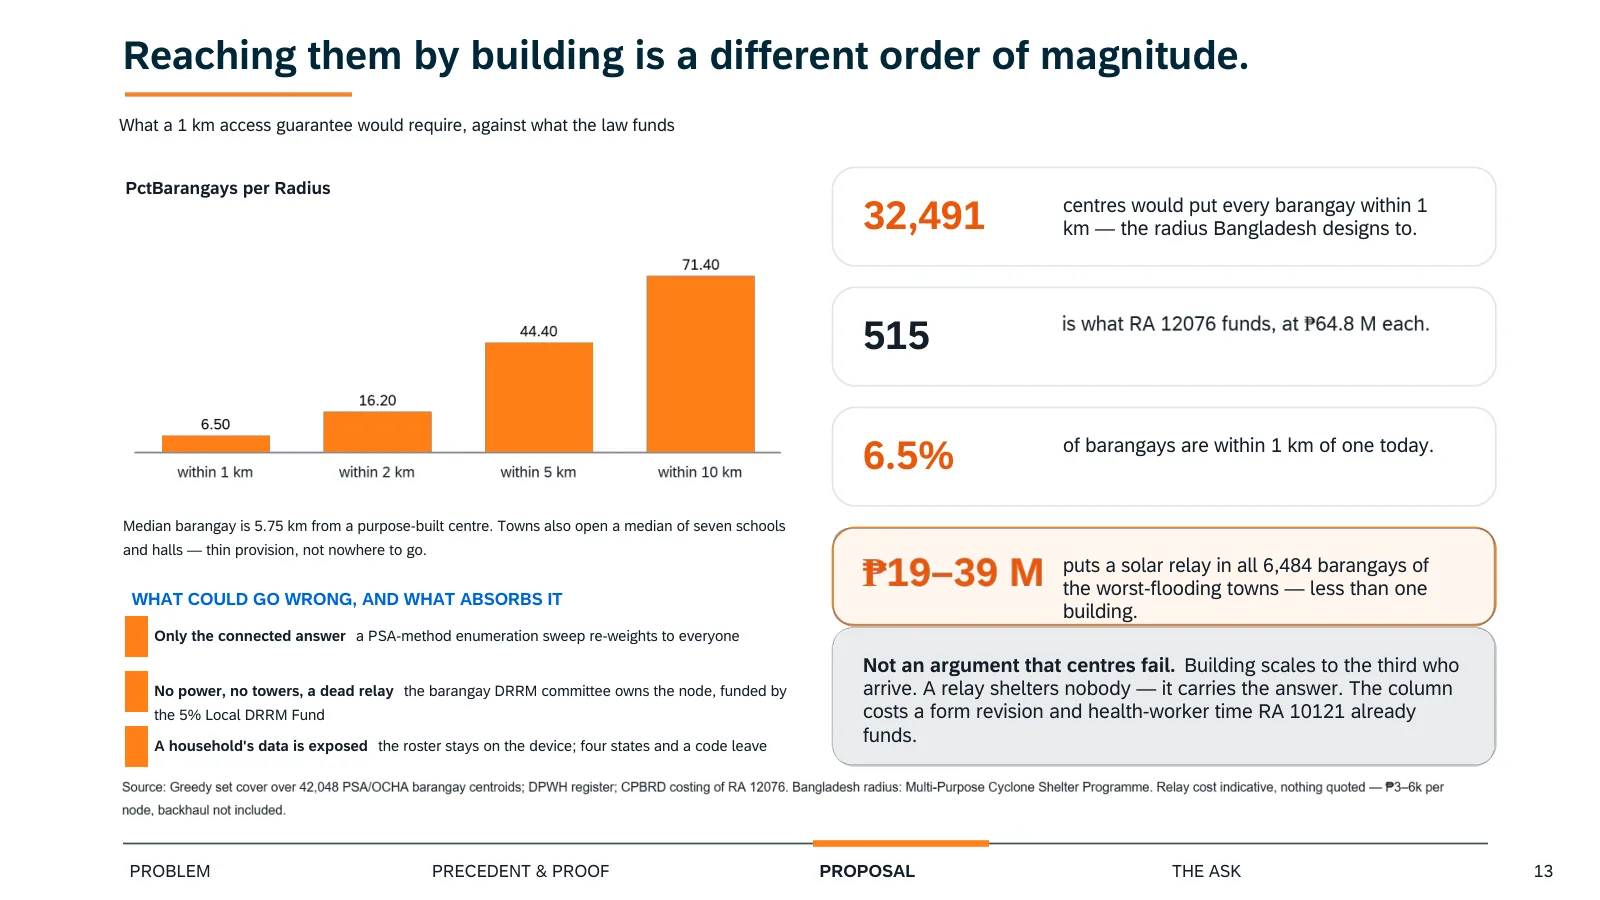
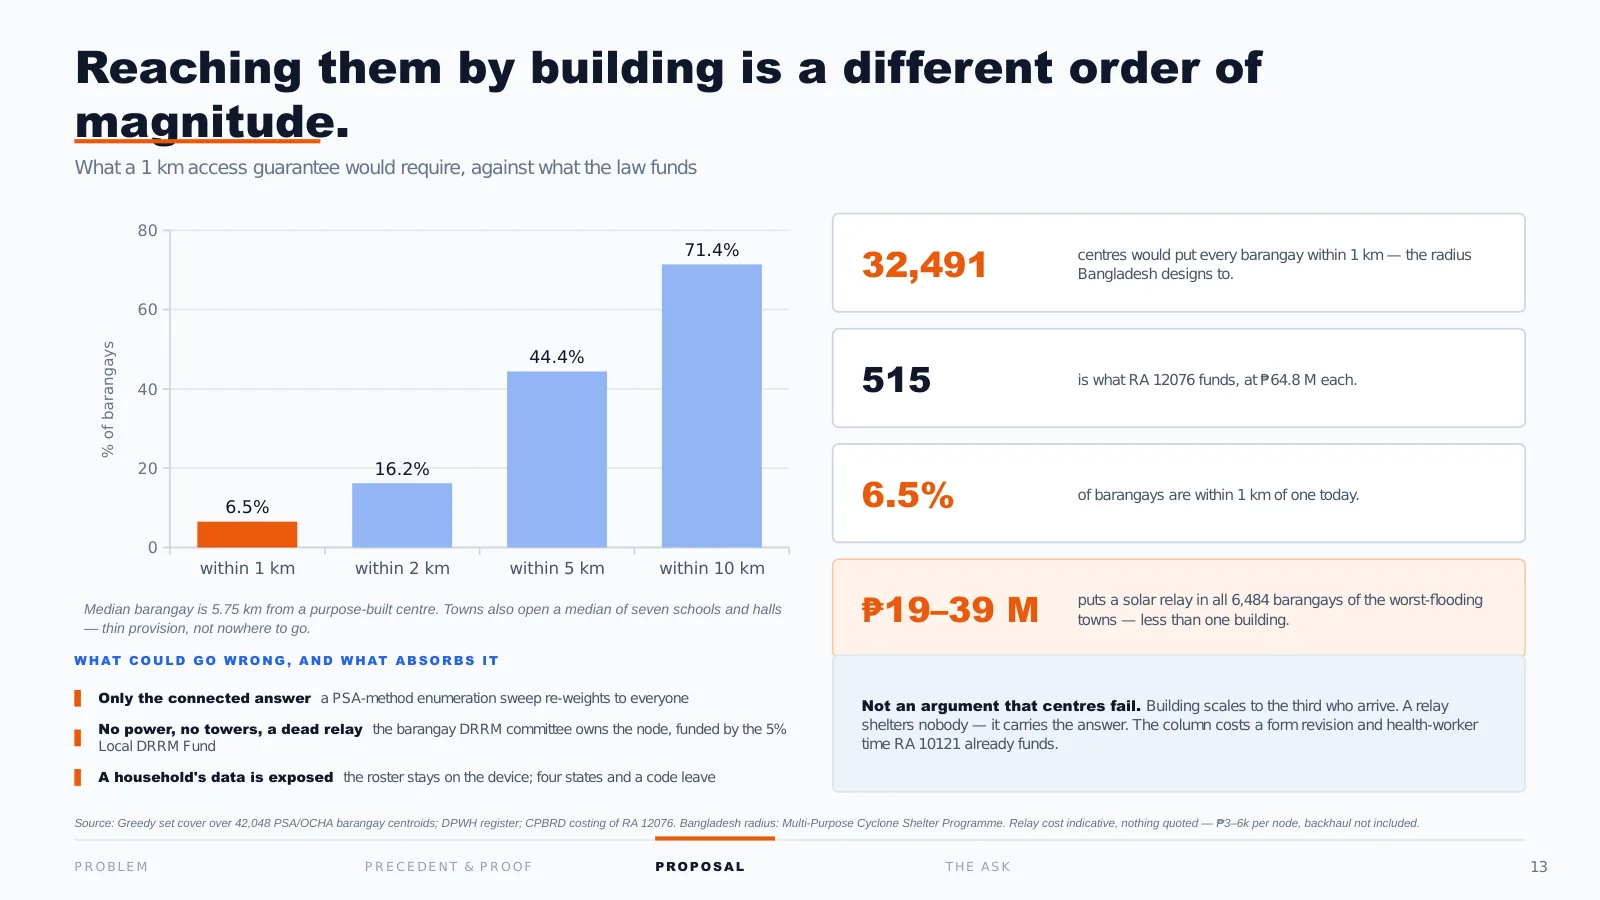
Bangladesh designs its cyclone shelters to a 1 km access radius. We ran that arithmetic across all 42,000 Philippine barangays. To put every barangay within 1 km would take 32,491 centres. RA 12076 funds 515. Today, 6.5% of barangays are within a kilometre of one.
That is not an argument that centres fail. It is that building scales to the third who arrive. And to answer the question you are about to ask, what ours costs: the relays are PHP 19 to 39 million, less than one building, and the column itself costs a form revision and health-worker time that RA 10121 already funds.
Looking back. That relay cost was wrong, and in the direction that flattered us. It assumed PHP 3,000 to 6,000 per relay. When we priced it properly, from manufacturer list prices and official rate schedules, an installed relay came to about PHP 28,000: 4.7 to 9.1 times more. The full system costs are in Appendix A.
14 · The regional ask
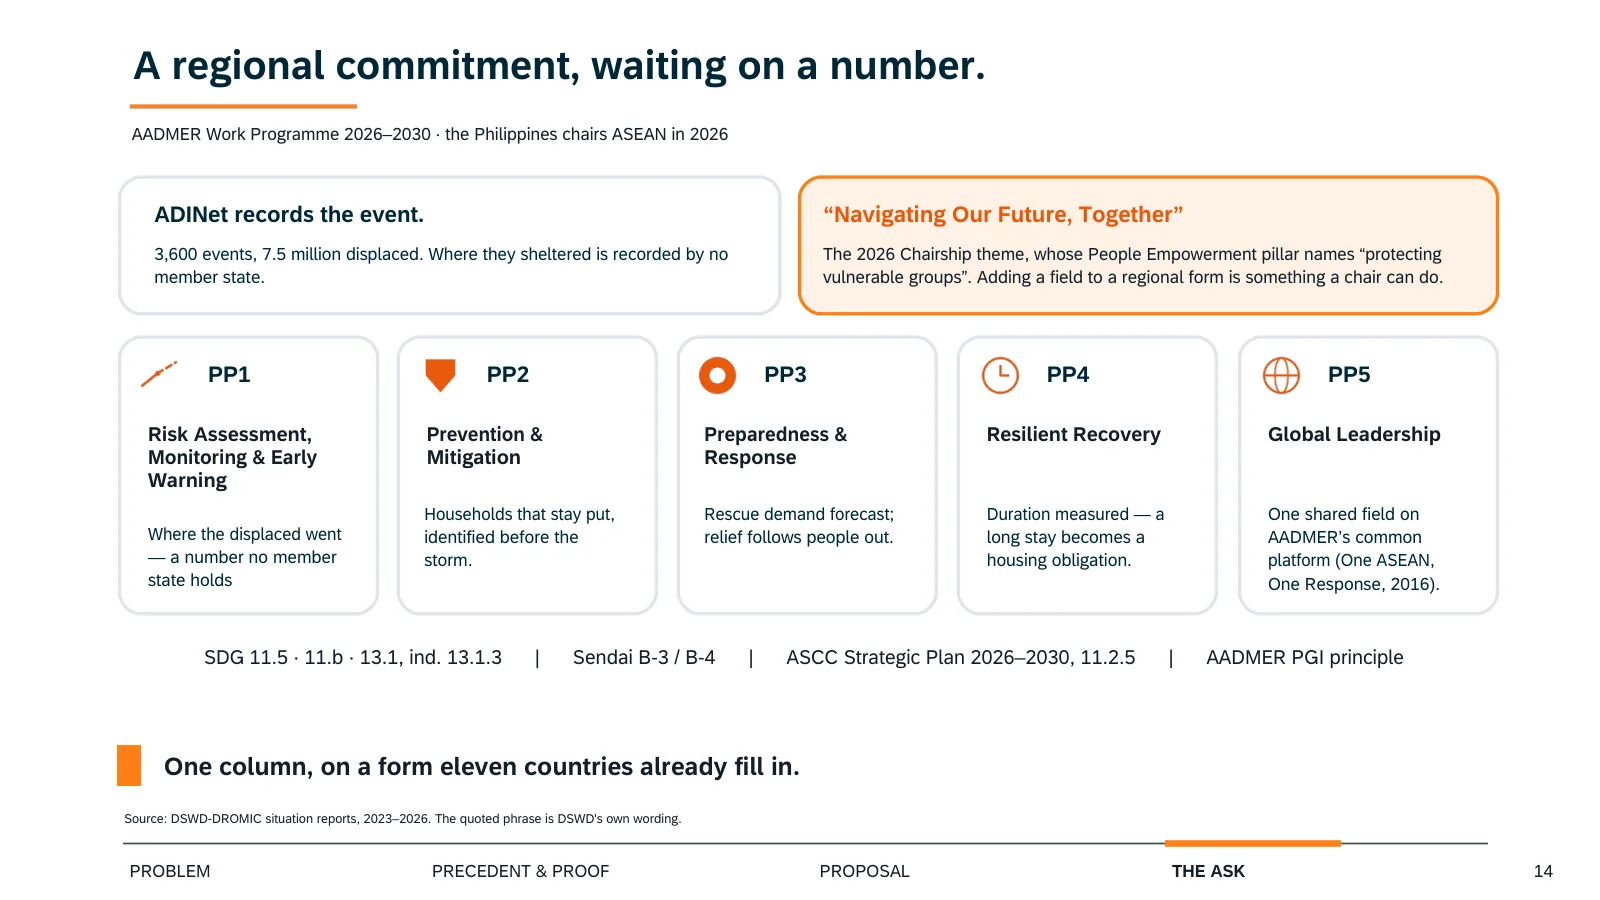
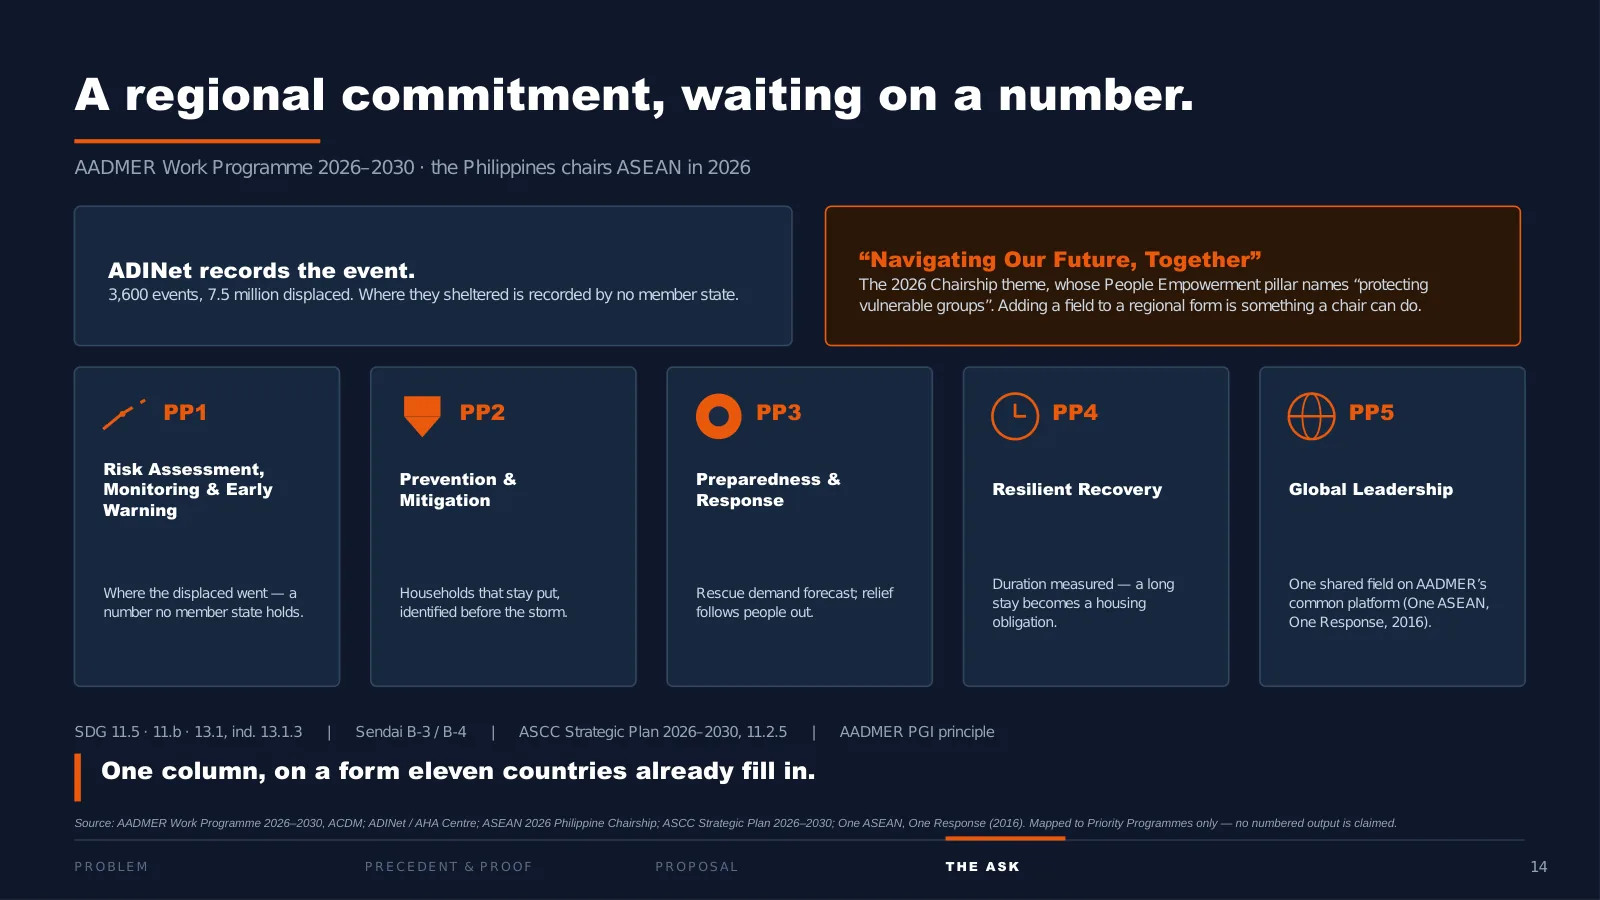
This is why it belongs to ASEAN and not only to us. ADINet records the event; where people sheltered is recorded by no member state. It maps to all five AADMER priority programmes, and to SDG targets 11.5, 11.b and 13.1.
And the timing is not an accident. The Philippines chairs ASEAN this year, under “Navigating Our Future, Together.” Adding a field to a regional form is exactly the kind of thing a chair can do, and this year the chair is the country with the most to gain from it.
15 · Close
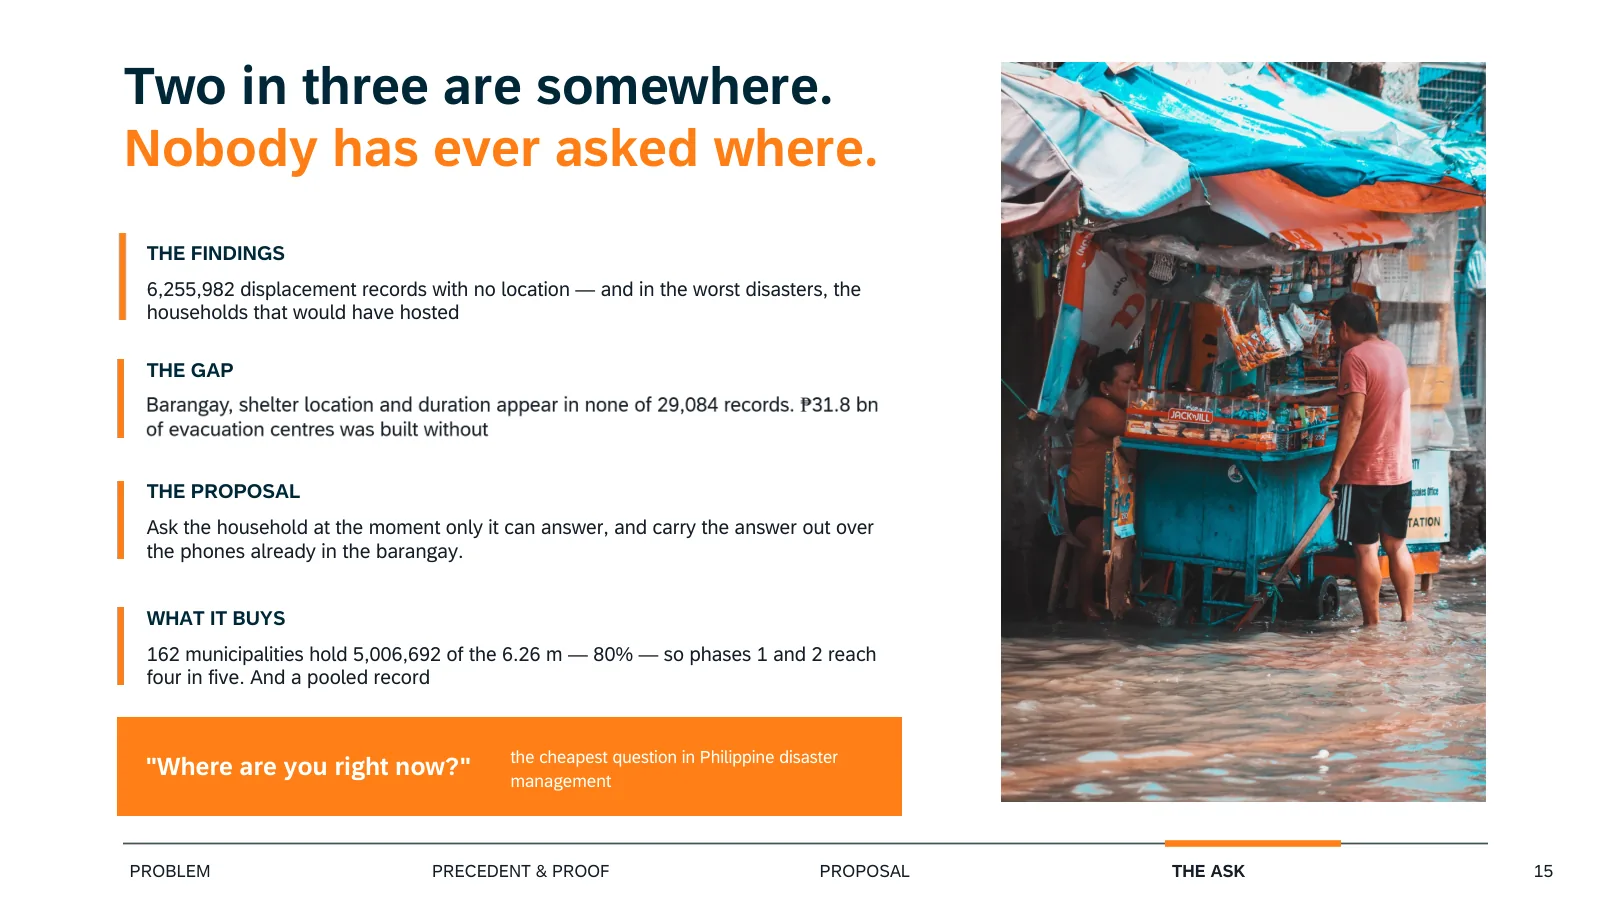
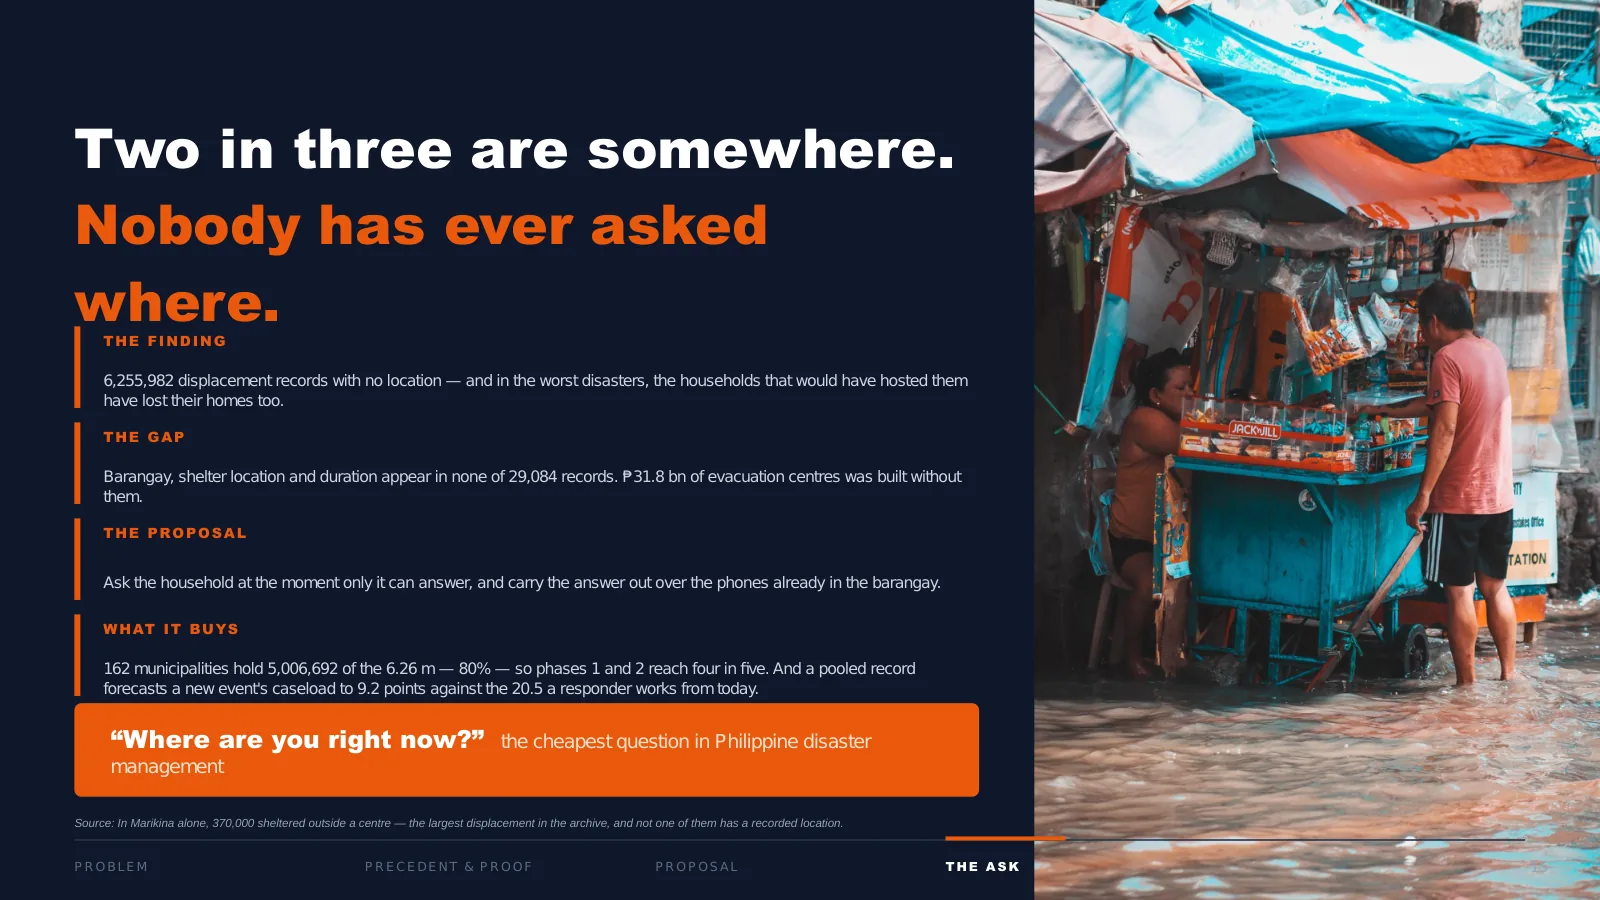
About 6.25 million people sheltered somewhere. Our records know that they left. They do not know where they went, how long they stayed, or whether they ever got home.
In Marikina alone that is 370,000 people, and not one of them has a recorded location.
One column. One question. Four buttons.
Where are you right now? The cheapest question in Philippine disaster management.
Appendix A · What SILONG would cost
Our deck gave only a relay cost, and it was too low (see page 13). On the deadline day we finished a full cost model: every line from manufacturer list prices or official Philippine rate schedules, covering hardware, installation, connectivity, software, staff, training, hosting, SMS, maintenance, replacement and loss. All figures are in September 2026 pesos, with low, base and high cases.
Phase 1: one province (Bulacan, 572 barangays), the first year plus six months
| item | Low | Base | High |
|---|---|---|---|
| The pilot as proposed | PHP 27.8 million | PHP 63.1 million | PHP 121.9 million |
Phase 2: the national priority deployment (109 towns, 4,315 barangays), five years
| item | Low | Base | High |
|---|---|---|---|
| Setup (year 0) | PHP 86.7 million | PHP 261.2 million | PHP 488.3 million |
| Running cost, each year | PHP 14.7 million | PHP 31.8 million | PHP 85.5 million |
| Five-year total | PHP 164 million | PHP 491 million | PHP 1.19 billion |
| Per barangay, five years | PHP 38,021 | PHP 113,740 | PHP 276,361 |
What drives it. The 109 towns are the ones holding 80% of the people recorded sheltering outside a centre. The five-year total includes a battery replacement in year 3, a device refresh in year 4, and a scope allowance for what the model doesn’t yet itemise. An installed relay costs PHP 13,257, PHP 28,453 or PHP 54,294 in the three cases.
For scale. RA 12076 funds about 515 evacuation centres at about PHP 64.8 million each. The base five-year cost of Phase 2 is about 1.5% of the law’s PHP 33.4 billion.
What this is not. A model, not a quote. Nothing here has been tendered, and the cases are wide on purpose.
Appendix B · What we corrected after the fact
| What we said | What was wrong | What replaced it |
|---|---|---|
| A relay costs PHP 3,000 to 6,000 (page 13), on “hardware costing a few thousand pesos” (page 12) | Too cheap by 4.7 to 9.1 times | About PHP 28,000 installed, base case (Appendix A) |
| “Today the same family is posted five times on Facebook, and counted as five” (page 11) | We never had a source for the number | Withdrawn. What the prototype does stands: one household reports once |
| The count of towns that received no evacuation-centre money (page 7) | Some towns were counted twice under two spellings | Merged by official town code. The headline held; the count on the slide was too high |
| An international per-capita figure for the Philippines (drafts) | The data feed covered 0.66% of the period we described | The validated annual figures from the same source |
| An ASEAN-wide comparison chart (drafts) | It rested on 7 of 11 member states, 2 of them inferred | Cut |
| Paying the households that host displaced families (early solution) | Hosting is a recognised shelter choice; payments were the wrong instrument | Planning: where to put centres, how to prepare, how to respond |
| The evacuation-centre spending comparison | Not the test we pre-registered (that was flood control, never run) | Labelled exploratory, with barred claims: not waste, corruption or misallocation, and no cause |
| “By 9 points” across towns (script, page 6) | That estimate is a ranking of towns, not percentage points | Read only its direction: negative. The redraw marks it as a ranking |
| “About 6.25 million people sheltered somewhere” (script, page 15) | The 6.26 million counts displacements; someone displaced twice is counted twice | About 6.25 million displacements ended outside a centre |
Appendix C · The questions we prepared for
| If a judge asked | We would have said |
|---|---|
| “So do more centres help or not?” | We can’t sign it, and we say so. Supply follows severity, so no specification identifies an effect either way. That’s a claim about the record, not about centres. |
| “Your forecast is fitted on seven events?” | Yes, and the slide says so. That’s why we show the spread rather than a single line. Seven events can’t support a formal interval. |
| “Doesn’t page 8 contradict page 6?” | No. Page 8 predicts where the caseload will be. Page 6 says we can’t identify why it moved. Forecasting is not identification. |
| “Aren’t pages 6, 7 and 13 contradicting each other?” | Three different claims: we can’t identify an effect (6), buildings reach only the third who arrive (7), building doesn’t scale to an access guarantee (13). All three can be true at once. |
| “Page 3 has an inside and outside split; page 9 says the column doesn’t exist. Which is it?” | Both. DROMIC publishes a town-level count inside and outside. It has never published a located record: no barangay, no duration. |
| “Isn’t 9.66 million double-counted?” | It’s de-duplicated within each event, then summed across events, so it counts displacements, not unique people. The slide says so. |
| “What about households with no smartphone?” | A mesh needs some phones, not every phone, and barangay health workers already make household rounds on one shared device. |
| “Why believe the app reaches people who ignore evacuation orders?” | We don’t claim it does. That’s the bias we name on page 10, and the enumeration sweep is how it gets corrected. |
| “Who maintains a dead relay?” | The barangay disaster risk reduction and management (DRRM) committee owns the node, funded from the 5% Local DRRM Fund. |
| “Are the charts really from SAC?” | Yes. Every chart on the submitted storyboard was built in SAP Analytics Cloud. The photographs and prototype screens are not charts. |
One answer we prepared is not here: what SILONG costs. Our prepared answer quoted the relay figure that turned out to be too low. Appendix A has the real one.
Credits
Thank you, Kim, my teammate, for sharing your expertise and knowledge from the first topic to the last page; for your analysis of forest lost to mining, which gave us our strongest single result; for working out how to build our storyboard in SAP Analytics Cloud and getting our data to chart; and for reading our work with a sceptic’s eye and catching what my scripts didn’t. I couldn’t have asked for a better partner.
Sources
As printed on the storyboard’s reference page (page 16), with the dates each was read:
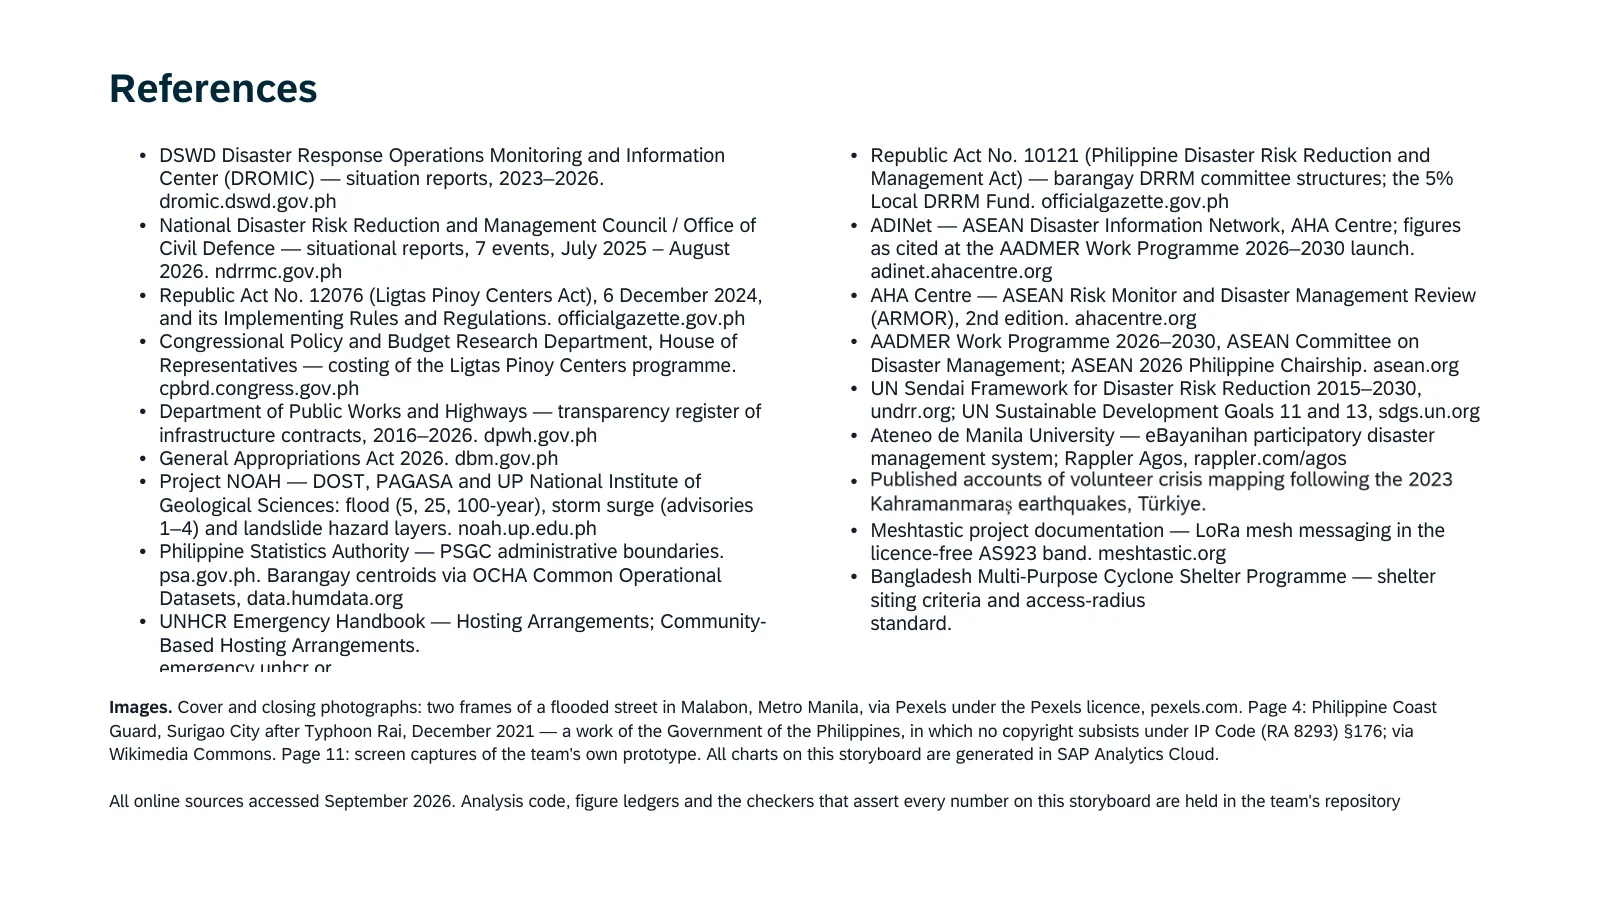
- Department of Social Welfare and Development. Disaster Response Operations Monitoring and Information Center (DROMIC): situation reports, 2023 to 2026. dromic.dswd.gov.ph. Read 1 Aug 2026; event series read 29 to 30 Aug 2026.
- National Disaster Risk Reduction and Management Council and Office of Civil Defense: situational reports, 7 events, Jul 2025 to Aug 2026. ndrrmc.gov.ph. Read 29 Aug 2026.
- Republic Act No. 12076 (Ligtas Pinoy Centers Act), 6 Dec 2024, and its Implementing Rules and Regulations. officialgazette.gov.ph.
- Congressional Policy and Budget Research Department, House of Representatives: costing of the Ligtas Pinoy Centers programme, as reported by The Philippine Star, 15 Nov 2023 (PHP 33.4 billion; about PHP 64.8 million per building). Read 14 Nov 2026.
- Department of Public Works and Highways: transparency register of infrastructure contracts, 2016 to 2026, via the BetterGov mirror (MIT licence). Read 3 Sep 2026.
- General Appropriations Act 2026. dbm.gov.ph.
- Project NOAH (DOST, PAGASA and UP National Institute of Geological Sciences): flood (5, 25 and 100-year), storm surge (advisories 1 to 4) and landslide hazard layers. noah.up.edu.ph.
- Philippine Statistics Authority: PSGC administrative boundaries; barangay centroids via the OCHA Common Operational Datasets, data.humdata.org.
- UNHCR Emergency Handbook: Hosting Arrangements; Community-Based Hosting Arrangements. emergency.unhcr.org.
- Republic Act No. 10121 (Philippine Disaster Risk Reduction and Management Act): barangay DRRM committee structures and the 5% Local DRRM Fund. officialgazette.gov.ph.
- AHA Centre: ASEAN Disaster Information Network (ADINet), figures as cited at the AADMER Work Programme 2026 to 2030 launch. adinet.ahacentre.org. Read 31 Aug 2026.
- AHA Centre. 2020. ASEAN Risk Monitor and Disaster Management Review (ARMOR), 2nd edition. ahacentre.org. 164 pages, text-searched for “host” and “relatives”. Read 28 Aug 2026.
- ASEAN Committee on Disaster Management: AADMER Work Programme 2026 to 2030; ASEAN 2026 Philippine Chairship. asean.org.
- UN Sendai Framework for Disaster Risk Reduction 2015 to 2030, undrr.org; UN Sustainable Development Goals 11 and 13, sdgs.un.org.
- Ateneo de Manila University: eBayanihan participatory disaster management system; Rappler Agos, rappler.com/agos.
- Published accounts of volunteer crisis mapping after the 2023 Kahramanmaraş earthquakes, Türkiye.
- Meshtastic project documentation: LoRa mesh messaging in the licence-free AS923 band. meshtastic.org.
- Bangladesh Multi-Purpose Cyclone Shelter Programme: shelter siting criteria and access-radius standard.
Added on this page:
- The cost model in Appendix A: manufacturer list prices and official Philippine rate schedules, September 2026 pesos.
Images on the slides, as credited on page 16: cover and closing photographs, two frames of a flooded street in Malabon, Metro Manila, via Pexels under the Pexels licence. Page 4: Philippine Coast Guard, Surigao City after Typhoon Rai, December 2021, a work of the Government of the Philippines, in which no copyright subsists under the Intellectual Property Code (RA 8293) §176, via Wikimedia Commons. Page 11: screen captures of the team’s own prototype. All charts on the submitted storyboard were generated in SAP Analytics Cloud. The “as designed” pages use the same photographs; their charts were drawn in the slide file, not in SAC, which is why that version was never submitted.
end of silong-storyboard.md. back: ~/writing/notes/the-checks-caught-my-mistakes.md