14 min readdatalessonscompetitions
The checks caught my mistakes. They couldn't catch my priorities.
What 755 disaster reports, a competition and one missed shortlist taught me about checking my own work.
More than nine million times in three years, a disaster forced someone in the Philippines out of their home. For over six million of those, the government’s record of where they went is the same seven words: they “temporarily stayed with their relatives or friends.” No barangay. No duration. No outcome.
Silong is the space beneath a house, where a family goes when the water rises. I spent nine weeks looking for those families in the records, and found that the record loses every one. But the lesson I took away wasn’t about the data. It was about how often I was wrong, and how I caught it.
Fifteen pages meant one idea
ASEAN Data Science Explorers, a competition across the Association of Southeast Asian Nations (ASEAN), asks two-person teams to build a data storyboard in SAP Analytics Cloud (SAC) on a problem tied to a UN Sustainable Development Goal (SDG). My teammate Kim Lee and I entered as team ArcheType from De La Salle University.
Before choosing a topic, we read every podium storyboard since 2017. Every medallist since 2023 ran 44 to 70 pages. The 2026 rules said 15. We followed the rule, which meant the deck had to win on one sharp insight, not breadth.
I wrote down what would kill each idea first
We didn’t start with a topic. We started with a long list of them, most of them surface level, each tied to an SDG. Then we tried combining SDGs, and a few of the topics, into something bigger. We judged what was left on two things: whether the data existed, and whether it mattered to the Philippines and to ASEAN. That cut the list to a shortlist of three.
We took all three forward in parallel. For each, before building anything, I wrote down what result would kill it.
My first idea was that search trends and rainfall could warn of dengue outbreaks before official counts did. I ran the test I had written. Sixteen predictors, and every one lost to plain persistence: last week’s cases predicted this week’s better than anything else. The idea was dead, and I said so in writing.
Kim’s candidate produced the strongest single result either of us found. Kim ranked provinces by satellite-detected forest loss caused by mining, without looking at who mines where. The nickel industry association’s own seven member provinces came back at ranks 1 to 6, and 9.
The third was climate displacement, and it’s the one we chose. It had real potential, it was the one we could finish to the standard we had set, and it’s what keeps happening to our own country.
Two in three never reach a centre
The Department of Social Welfare and Development (DSWD) publishes situation reports during every disaster, often twice a day. We extracted every municipality from three years of them, 2023 to 2026: 9.6 million displacements. Separately, we read 755 reports from two agencies to see how sheltering changes over the course of a single disaster. Across the seven disasters with enough reports to follow day by day, the typical share outside a centre climbed from about 12% on the first day to a little over half by week three.
Two in every three displacements ended somewhere other than an evacuation centre. For those people, report after report, the record still says only that they “temporarily stayed with their relatives or friends.”
How to read it: The whole bar is every displacement from 2023 to 2026. Someone displaced twice counts twice. The blue part ended somewhere other than an evacuation centre: about two in every three.
It is tempting to read that as a system that works: families take each other in. So we tested it against how bad the disaster was. When no houses were destroyed, about half of the displaced sheltered outside a centre. When more than one house in five was destroyed, it fell to about a third. The informal network thins out exactly when it is needed most. In a typhoon that flattens one house in five, the cousin has lost hers too.
How to read it: Each bar is a group of disasters, sorted by how many homes they destroyed. Its height is the share of displacements that ended outside a centre. The dashed line carries the first bar's level across.
What checking caught here. Before we submitted, a second script recalculated every number on the page and flagged any that didn’t match the data: 102 checks by the end. Building them turned up 14 bugs in code I thought was finished, including:
- one that quietly dropped every Metro Manila town from the analysis;
- one that put whole provinces in the wrong region, because my extractor guessed each town’s province from how a report’s lines were indented;
- one that counted an international dataset as covering years it barely touched: 0.66% of the period I described.
None changed the main finding. Any one would have embarrassed us in front of a judge who checked a single number.
The answer that wouldn’t hold its sign
The obvious fix is more evacuation centres. I tried to prove it, and the data refused.
Comparing towns with each other, more centres goes with fewer people outside. Allow for how bad each disaster was, and it is still negative. But follow one town across its own disasters, and the sign flips: 19.5 points more. The last two estimates are both precise, and their confidence intervals do not overlap. They contradict each other because a town opens more centres because a bad storm is coming, so the centres and the severity arrive together.
Picture one town in two storms. For heavy rain, it opens a few centres, and most families stay with relatives. For a direct hit, it opens many more, and even more families end up outside, because the storm took their homes and their relatives’ homes too. More centres, more people outside: not because the centres pushed anyone away, but because the storm brought both.
How to read it: Each dot is one way of measuring whether towns with more evacuation centres have fewer people sheltering outside. Left of zero means fewer outside; right means more. The line through a dot is the range the true value probably sits in (95% confidence). The first measure is a ranking of towns rather than points, so it has no range; read only its direction.
What checking caught here. We put this on the page and led with the objection to our own argument. The conclusion is narrow on purpose: the record cannot tell you whether centres work. That is the case for a better record.
In late August, Kim ran an independent check of the deck and flagged page 2, where I compared all of ASEAN. The review that followed cut that comparison, even though I liked it: it rested on figures for only 7 of 11 member states, 2 of them inferred.
Where PHP 31.8 billion went
My first solution was to pay the households that take displaced families in. The literature took it apart. Humanitarian practice treats staying with a host family as a legitimate form of shelter, chosen for good reasons: work, family, staying close to home. So five days before the deadline we had at the time, the solution changed from payments to planning: where to put centres, how to prepare, how to respond.
Then the analysis found its sharpest result. The Department of Public Works and Highways (DPWH) publishes its contracts. We found 2,209 naming an evacuation facility, worth PHP 31.8 billion. PHP 20.0 billion of it could be placed in the 846 towns with a recorded displacement, and we lined those up against where people had sheltered.
The best-funded tenth of towns received 57.6% of the money. Those towns held 24.3% of the people in those 846 towns who sheltered outside.
How to read it: Both bars describe the same towns: the best-funded tenth. If money followed people, the two bars would be the same length.
What checking caught here. Before pulling this data, I had written down a different test in advance, on flood-control spending, and never ran it. So this comparison is one I found by looking, not one I set out to test, and our notes say so: it’s a lead, not a proof. We also wrote down what the deck was not allowed to claim: not waste, not corruption, not misallocation, and no cause. Centres are the right answer for the third of people who reach one. The finding is narrower: the main instrument reaches a third of the problem.
One check came too late. On the deadline day, a cost model I was building found some towns counted twice under two spellings. That made our count of towns that got nothing, 405 of 846, too high; the shares barely moved. I fixed it in the data after the competition. The deck still carries the old count.
Where it broke anyway
Our SAC account arrived on 30 Jul. We logged in, checked that it worked, and then didn’t go back to it until the last week, on 31 Aug. For five weeks the one tool we were required to use sat untouched while the analysis got deeper. We focused on the content and the analysis, because they kept finding things, and the charts felt like a few days’ work we could do at the end. They weren’t. I set three early dates to build a rough version of the storyboard in SAC and missed all three. When the organisers extended the deadline by a week, I spent most of the extra time building a working prototype of our solution. It was good work, and it couldn’t be submitted: the competition judges only the storyboard.
Good analysis that can’t be submitted is still unsubmitted. Those were my calls as team leader, and they are the ones I would change.
What the shortlist said
We submitted. When the shortlist for the national finals came out, we weren’t on it.
The organisers sent every team that missed the top 10 the same checklist: 21 common weaknesses, grouped under data and visualisation, analysis and insights, and recommendations. They explained that the number of entries meant they couldn’t give individual feedback. So I held our deck to that list, item by item. Some items didn’t apply: we listed specific SDG targets, used current data, included a full reference list, and named who would implement what. Four probably did:
- Fonts too small, slides too crowded. About two-thirds of the text on our pages was 10 point or smaller at standard slide size. We had moved much of the explanation into a spoken script, but a judge reading a PDF never hears it.
- Charts hard to read. Ours were built in SAC in the final days, while we were still fighting the tool over how it read our data.
- ASEAN community frameworks. The list asked for the ASEAN Socio-Cultural Community (ASCC) 2025 and ASEAN Economic Community (AEC) 2025 documents. We had the ASCC’s successor plan for 2026 to 2030, which I’d swapped in shortly before the deadline because the 2025 Blueprint had expired, and no AEC document at all. A judge checking for the 2025 documents would have found neither.
- Recommendations that may not be feasible. The cost we gave for our relays was 4.7 to 9.1 times too low; we only priced them properly on the deadline day, too late for the deck. A judge who doubted that number would have been right to.
And one was fair, even though I didn’t want to hear it: the issue was too broad. In 15 pages we went from a regional data gap to sheltering behaviour, to whether centres work, to where the money went, to a forecast, to a solution. Each page was defensible. Together they asked a judge to hold six ideas at once. We set out to win on one sharp insight and picked up five more.
The feedback was generic, so I can’t be certain. But as far as I can tell, it wasn’t the quality of the analysis that cost us. It was how much of it we tried to show, and how it reached the page.
If you’re about to do the same
Your method
- Write down what would kill your idea before you look at the data. It is the only way a negative result counts as a finding instead of a failure.
- Have a second script recalculate every number on the page, and fail loudly when one doesn’t match. Ours found 14 bugs before we submitted. I would have shipped every one of them.
- Open the tool you’ll be judged in during week one, and upload something rough early. You can replace a rough upload. You can’t replace a missing one.
- Use AI to help build your ideas, not to have them. We used an AI coding assistant to help write and check our code. What to study, what to test and what to claim were our calls.
Your pages
- Tell one story. Choose the one finding you want a judge to remember, and cut every page that doesn’t build toward it. Ours tried to tell six stories in 15 pages, and none of them got the room it needed.
- Read the export the way a judge will: as a PDF, page by page, at real size. We built and checked everything on our own screens, and assumed judges would read it the same way. They see the export. Our text was too small, our charts were hard to read, and one page went out with the tool’s editing panel still on it.
- Cite the frameworks the rubric names, with anything newer beside them, not in their place. I swapped one for its successor and left the other out entirely.
Your people
- Ask for help early, and use what your university gives you. Professors, classmates, friends in the field: reach out in week one, and send your questions in writing. A five-minute written reply beats a meeting that never happens; we planned a consult from July and never had it. Ask what only insiders know: is this really a problem here, which data or contacts you won’t find online, and what a judge will object to first.
- Use everything the organisers give you, and join whatever you can. Sessions, workshops, support forms: they exist to help you. If something about the rules is unclear, ask the day the channel opens.
- Ask a teammate to try to break it. Kim’s check caught what my scripts didn’t.
What I’m keeping
We didn’t make the finals, and honestly, the email left me with more questions than answers. But we’re proud of what we did. We tried something new: we went looking for the people the record loses, and we checked every step on the way. I’d hold the next project to the same checks.
The finding didn’t stop being true when that email arrived. More than six million displacements were still counted on the day and then lost. Somewhere beneath a house, a family is still waiting out the water, in a place the record was never built to see. The first step is to give that record one more column: where they went.
Credits
Thank you, Kim, my teammate, for sharing your expertise and knowledge from the first topic to the last page; for your analysis of forest lost to mining, which gave us our strongest single result; for working out how to build our storyboard in SAP Analytics Cloud and getting our data to chart; and for reading our work with a sceptic’s eye and catching what my scripts didn’t. I couldn’t have asked for a better partner.
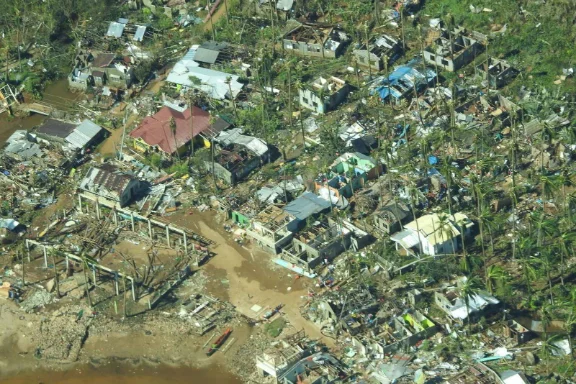
Photo: Philippine Coast Guard. Surigao City after Typhoon Rai, 17 Dec 2021. Public domain (a work of the Government of the Philippines), via Wikimedia Commons.
Sources
- ArcheType (Nuque, A. J., and Lee, K. W.). 2026. Two-Thirds Are Somewhere Else, storyboard submitted to ASEAN Data Science Explorers 2026. Shown in full on the walkthrough page.
- Department of Social Welfare and Development. 2023 to 2026. DROMIC situation reports. DSWD Disaster Response Operations Monitoring and Information Center. dromic.dswd.gov.ph. Read 1 Aug 2026; event series read 29 to 30 Aug 2026.
- National Disaster Risk Reduction and Management Council. 2025 to 2026. Situational reports. NDRRMC. ndrrmc.gov.ph. Read 29 Aug 2026.
- Department of Public Works and Highways. 2016 to 2026. Transparency data: contracts, via the BetterGov mirror (MIT licence), huggingface.co/datasets/bettergovph/dpwh-transparency-data. Read 3 Sep 2026.
- ASEAN Data Science Explorers. 2026. Storyboard requirements (read 30 Jul 2026) and competition timeline (read 7 Sep 2026). aseandse.org.
- ASEAN Secretariat. 2025. ASEAN Socio-Cultural Community Strategic Plan 2026 to 2030. asean.org. Read 10 Sep 2026.
Send a signal
end of the-checks-caught-my-mistakes.md. next: Walk through the storyboard